

March 2025 Purchase indicators of Plastics, Crude Oil, Rubber, Cotton, Sea freight, Currencies, Inflation Year, China Export rebates and China VAT
March 2025 Purchase indicators of Plastics, Crude Oil, Rubber, Cotton, Sea freight, Currencies, Inflation Year, China Export rebates and China VAT
The Electric bike industry March 2025 purchase indicators are like below:
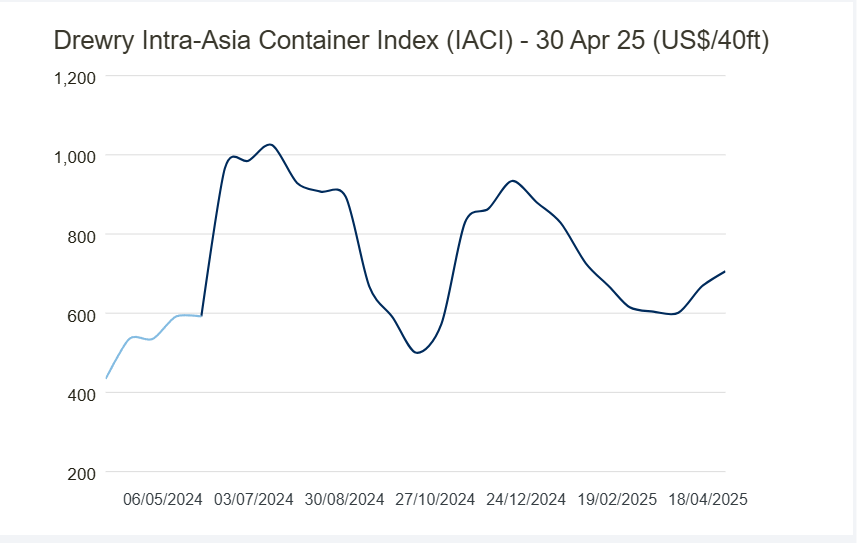
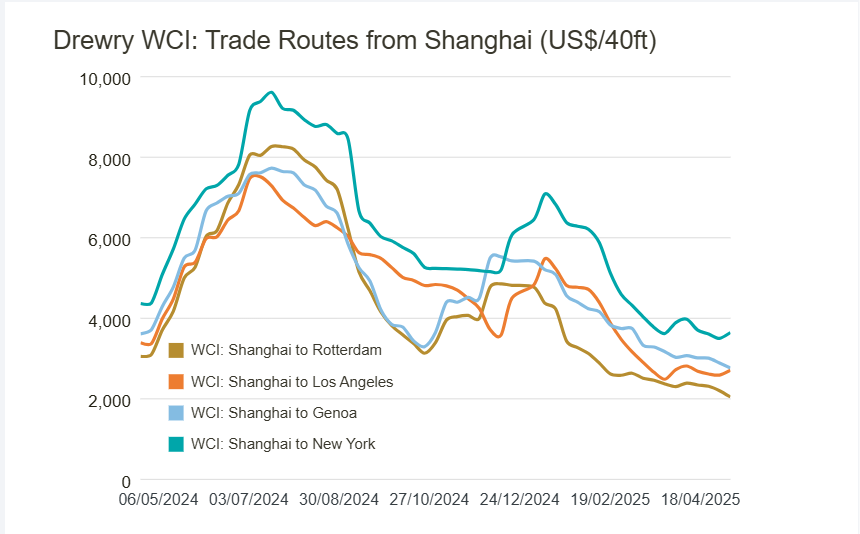
Rubber decreased by 11.3%, crude oil decreased by 1.4% in March (and a bigger drop in April so far). The container freight rates from China to Europe decreased around 10%-15%, and China to USA rates decreased by around 15%-30% in March.
Europe Plastics prices: Plastics: prices moved within narrow changes.
Original: https://www.plasticportal.eu/ Unit: EUR/Ton
| Indicator | Mar-24 | Apr-24 | May-24 | Jun-24 | Ju.-24 | Aug-24 | Sep-24 | Oct-24 | Nov-24 | Dec-24 | Jan-25 | Feb-25 | Mar-25 |
| PS (normal/clear) | 2,020 | 2,000 | 1,980 | 1,980 | 1,890 | 1,830 | 1,840 | 1,600 | 1,650 | 1,650 | 1,660 | 1,640 | 1,660 |
| HDPE (injection) | 1,430 | 1,310 | 1,340 | 1,340 | 1,390 | 1,280 | 1,460 | 1,360 | 1,240 | 1,320 | 1,300 | 1,310 | 1,330 |
| LLDPE (foil) | 1,440 | 1,310 | 1,290 | 1,290 | 1,210 | 1,320 | 1,350 | 1,290 | 1,190 | 1,230 | 1,300 | 1,340 | 1,350 |
| LDPE (foil) | 1,550 | 1,310 | 1,300 | 1,300 | 1,280 | 1,380 | 1,410 | 1,360 | 1,280 | 1,310 | 1,370 | 1,460 | 1,480 |
| PVC (foil) | 1,050 | 1,120 | 1,140 | 1,120 | 1,040 | 1,065 | 1,055 | 1,055 | 975 | 975 | 965 | 965 | 985 |
| ABS (natural) | 2,265 | 2,300 | 2,330 | 2,330 | 2,380 | 2,340 | 2,330 | 2,230 | 2,250 | 2,210 | 2,230 | 2,250 | 2,250 |
| PC (clear bright) | 3,530 | 3,530 | 3,530 | 3,530 | 3,220 | 3,410 | 3,380 | 3,330 | 3,220 | 3,260 | 3,350 | 3,410 | 3,300 |
| PP (homo) | 1,540 | 1,350 | 1,400 | 1,400 | 1,400 | 1,460 | 1,510 | 1,410 | 1,380 | 1,400 | 1,420 | 1,460 | 1,470 |
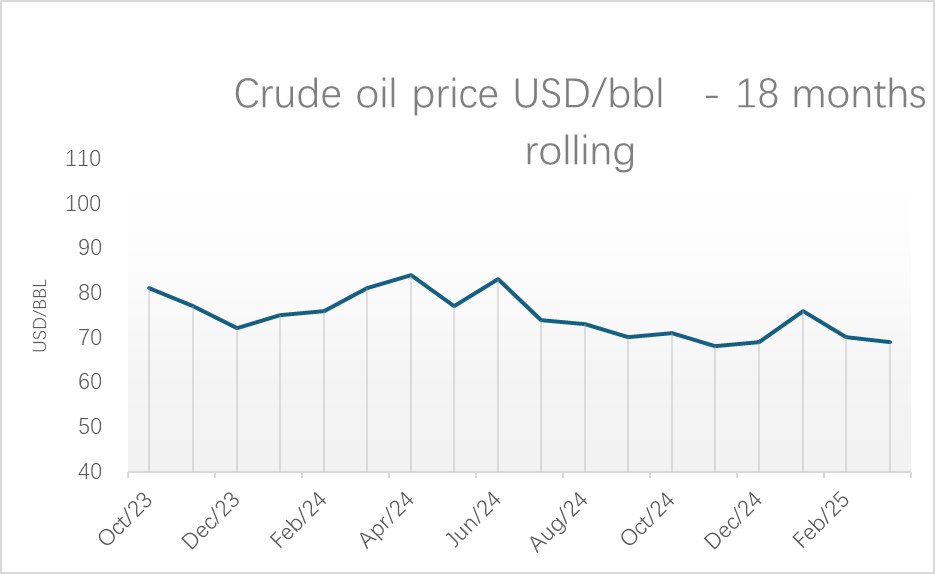
Oil: price declined from USD 70/bbl to USD 69/bbl in March(-1.4%), as the US-China trade war is expected to shrink the demand.
- Although Trump granted exclusions from steep tariffs on electronic products imported from China, he indicated that a new round of levies will be announced in due course, adding to continued uncertainty.
- OPEC+ decided to faster increase output.
- On the geopolitical front, signs of easing tensions between the U.S. and Iran may further boost global supply, particularly for key buyer China.
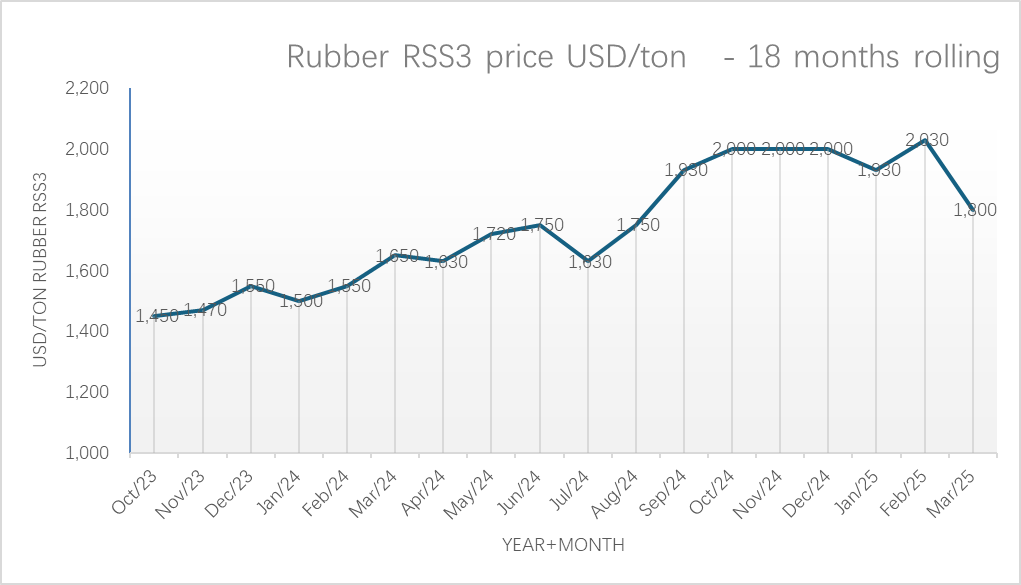
Rubber: Rubber: price increased from USD 1,930/ton to USD 2,030 in March(+5.2%).
Cotton: price drop from USD 1,500/ton to USD 1,430/ton in March(-4.7%, 1,470/ton as of today).
- Concerns about US trade policies.
- The USDA reported an increase in upland cotton net sales.
- Improved demand was noted, with expectations for strong sales from March through May.
- Overall, market sentiment showed signs of recovery after a prolonged bearish trend.
Packing material original: Euwid
| Indicator | Mar-24 | Apr-24 | May-24 | Jun-24 | Jul-24 | Aug-24 | Sep-24 | Oct-24 | Nov-24 | Dec-24 | Jan-25 | Feb-25 | Mar-25 |
| Crude oil (USD/bbl) | 81 | 84 | 77 | 83 | 74 | 73 | 70 | 71 | 68 | 69 | 76 | 70 | 69 |
| Kraftliner packaging material | 1,000 | 1,000 | 1,000 | 1,075 | 1,075 | 1,075 | 1,110 | 1,110 | 1,110 | 1,110 | 1,110 | 1,090 | 1,800 |
| Wellenstoff packaging material | 590 | 590 | 590 | 630 | 660 | 660 | 670 | 630 | 630 | 630 | 630 | 650 | 1,090 |
| Testliner II packaging material | 620 | 620 | 620 | 660 | 690 | 690 | 700 | 660 | 660 | 660 | 660 | 680 | 650 |
| Rubber RSS3 (USD/ton) | 1,650 | 1,630 | 1,720 | 1,750 | 1,630 | 1,750 | 1,930 | 2,000 | 2,000 | 2,000 | 1,930 | 2,030 | 680 |
| Cotton (input for CAB)
( USD/ton) |
2,000 | 1,830 | 1,730 | 1,540 | 1,500 | 1,500 | 1,560 | 1,560 | 1,560 | 1,540 | 1,500 | 1,430 | 1,400 |
Sea freight in March:
China – Europe: decreased from USD 1,700/20FT to USD 1,530/20FT (-10%)
Shanghai – Europe: decreased from USD 1,600/20FT to USD 1,360/20FT (-15%).
China – US Westcoast: decreased from USD 960/20FT to USD 810/20FT (-15.6%).
The USA’s new tariffs will reduce the worldwide trade market and affect the shipping freight a lot.
- USA tariffs on exports from a list of nearly 60 countries range from a level of 11% for Congo to 50% for Lesotho. These duties apply to all exports not loaded by April 9, 2025.
- As the Trump administration seems to target China, many companies in China shift accelerated a China+1 strategy. This trend was apparent in the increases in US trade with Mexico and Canada, and with alternatives in Asia like Vietnam, India, Taiwan and Bangladesh – at the expense of Chinese imports to the US which declined from 20% of total US imports in 2018 to 13% in 2024. This time though, the reciprocal tariffs make these alternatives less attractive. For example, goods from the below countries will meet accelerated tariffs:
Vietnam: 46%, India: 27%, Bangladesh: 37%, Cambodia: 49%
The US tariff policies will be on hold for 90 days to countries who have no retaliatory tariffs.
- The US tariffs on China import have increased to 145%, and 125% the other way. Both are expected to result in substantially lower ocean transport.
Currencies: Original: wwwoandacom
Currencies:
Currencies in March:
EUR/USD: increase from 1:1.04 to 1:1.08 (+3.85%).
EUR/JPY: increased from 1: 158.05 to 1:160.87 (-1.8%).
EUR/CNY: increased 1:7.56 to 1:7.82 (+3.4%).
USD/JPY: decreased from 1: 1:151.79 to 1:149.14. (-1.7%).
USD/TWD: a little moved from 1: 32.79 to 1:32.97 (+0.5%).
USD/CNY: slight decrease from 1:7.26 to 1:7.25 (-0.14%).
| Indicator | Mar-24 | Apr-24 | May-24 | Jun-24 | Jul-24 | Aug-24 | Sepr-24 | Oct-24 | Novr-24 | Dec-24 | Jan-25 | Feb-25 | Mar-25 |
| EUR/USD | 109 | 107 | 108 | 108 | 108 | 110 | 111 | 109 | 106 | 105 | 103 | 104 | 1.08 |
| EUR/JPY | 16271 | 16504 | 16836 | 17005 | 17112 | 16146 | 15887 | 16322 | 16310 | 16122 | 16202 | 15805 | 160.87 |
| EUR/CNY | 782 | 776 | 781 | 780 | 787 | 787 | 786 | 773 | 765 | 763 | 756 | 756 | 7.82 |
| EUR/TWD | 3441 | 3467 | 3490 | 3484 | 3540 | 3550 | 3547 | 3498 | 3436 | 3411 | 3400 | 3414 | 35.56 |
| USD/JPY | 14977 | 15394 | 15576 | 15804 | 15771 | 14624 | 14284 | 14977 | 15348 | 15391 | 15657 | 15179 | 149.14 |
| USD/NT$ | 3168 | 3234 | 3230 | 3239 | 3263 | 3223 | 3194 | 3210 | 3234 | 3257 | 3286 | 3279 | 32.97 |
| USD/CNY | 720 | 724 | 723 | 725 | 726 | 715 | 707 | 709 | 720 | 728 | 730 | 726 | 7.25 |
| EUR/VND | 26,850 | 26,990 | 27,500 | 27,370 | 27,500 | 27,600 | 27,350 | 27,280 | 26,930 | 26,620 | 26,150 | 26,400 | 27,540 |
| USD/THB | 3594 | 3675 | 3660 | 3671 | 3623 | 3471 | 3326 | 3335 | 3439 | 3413 | 3425 | 3375 | 33.80 |
Inflation Year on Year %, China Export rebates and China VAT
| Indicator | Mar-24 | Apr-24 | May-24 | Jun-24 | Jul-24 | Aug-24 | Sep-24 | Oct-24 | Nov-24 | Dec-24 | Jan-25 | Feb-25 | Mar-25 |
| Japan Inflation (CPI) YOY % | 2.70% | 2.50% | 2.80% | 2.80% | 2.80% | 3.00% | 2.50% | 2.30% | 2.90% | 3.60% | 4.00% | 3.70% | |
| Taiwan Inflation (CPI) YOY % | 2.14% | 1.95% | 2.24% | 2.42% | 2.52% | 2.36% | 1.82% | 1.69% | 2.08% | 2.10% | 2.66% | 1.58% | 2.29% |
| China Inflation (CPI) YOY % | 0.10% | 0.30% | 0.30% | 0.20% | 0.50% | 0.60% | 0.40% | 0.30% | 0.20% | 0.10% | 0.50% | -0.70% | -0.10% |
| Vietnam Inflation (CPI) YOY % | 3.97% | 4.40% | 4.44% | 4.34% | 4.36% | 3.45% | 2.63% | 2.89% | 2.77% | 2.94% | 3.63% | 2.91% | 3.31% |
| China Export rebates | 13% | 13% | 13% | 13% | 13% | 13% | 13% | 13% | 13% | 13% | 13% | 13% | 13% |
| China VAT | 13% | 13% | 13% | 13% | 13% | 13% | 13% | 13% | 13% | 13% | 13% | 13% | 13% |


Leave a Reply
Want to join the discussion?Feel free to contribute!