


March 2025 Purchase indicators of Plastics, Crude Oil, Rubber, Cotton, Sea freight, Currencies, Inflation Year, China Export rebates and China VAT
March 2025 Purchase indicators of Plastics, Crude Oil, Rubber, Cotton, Sea freight, Currencies, Inflation Year, China Export rebates and China VAT
The Electric bike industry March 2025 purchase indicators are like below:
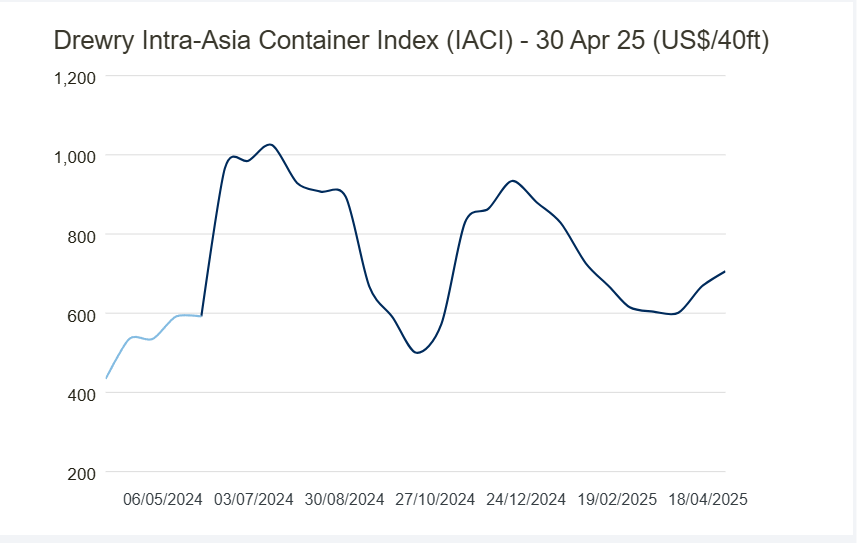
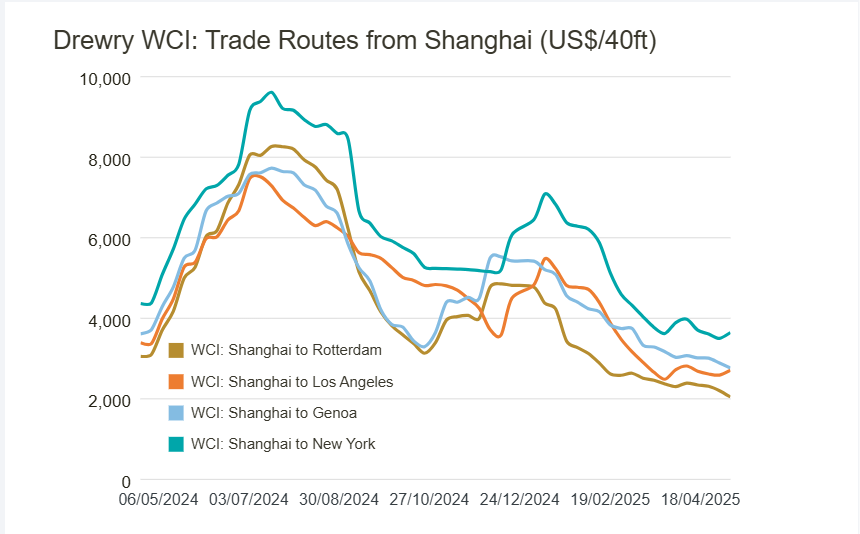
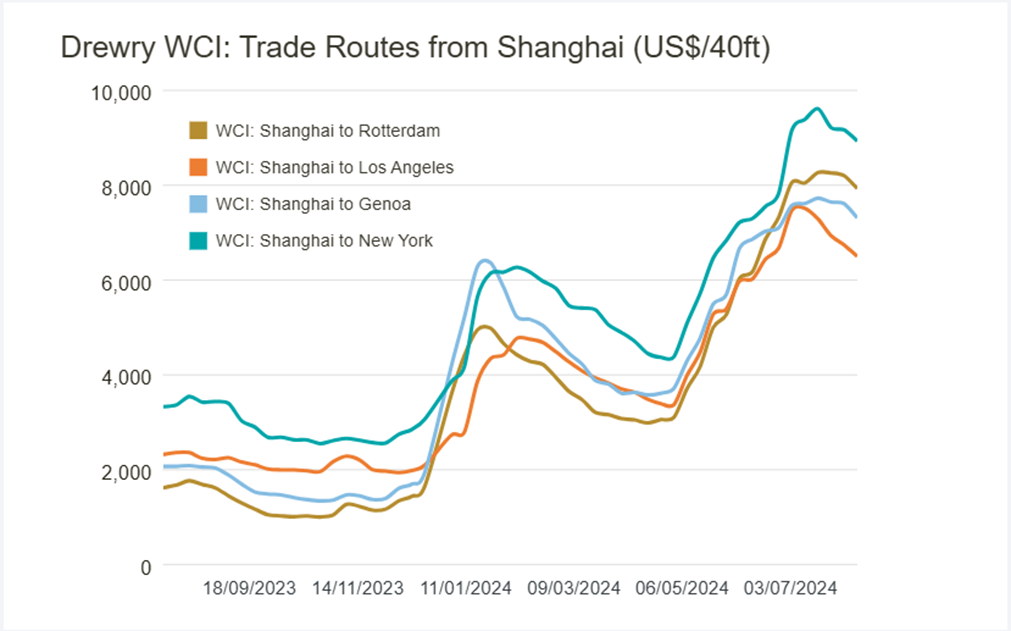
Rubber decreased by 11.3%, crude oil decreased by 1.4% in March (and a bigger drop in April so far). The container freight rates from China to Europe decreased around 10%-15%, and China to USA rates decreased by around 15%-30% in March.
Europe Plastics prices: Plastics: prices moved within narrow changes.
Original: https://www.plasticportal.eu/ Unit: EUR/Ton
| Indicator | Mar-24 | Apr-24 | May-24 | Jun-24 | Ju.-24 | Aug-24 | Sep-24 | Oct-24 | Nov-24 | Dec-24 | Jan-25 | Feb-25 | Mar-25 |
| PS (normal/clear) | 2,020 | 2,000 | 1,980 | 1,980 | 1,890 | 1,830 | 1,840 | 1,600 | 1,650 | 1,650 | 1,660 | 1,640 | 1,660 |
| HDPE (injection) | 1,430 | 1,310 | 1,340 | 1,340 | 1,390 | 1,280 | 1,460 | 1,360 | 1,240 | 1,320 | 1,300 | 1,310 | 1,330 |
| LLDPE (foil) | 1,440 | 1,310 | 1,290 | 1,290 | 1,210 | 1,320 | 1,350 | 1,290 | 1,190 | 1,230 | 1,300 | 1,340 | 1,350 |
| LDPE (foil) | 1,550 | 1,310 | 1,300 | 1,300 | 1,280 | 1,380 | 1,410 | 1,360 | 1,280 | 1,310 | 1,370 | 1,460 | 1,480 |
| PVC (foil) | 1,050 | 1,120 | 1,140 | 1,120 | 1,040 | 1,065 | 1,055 | 1,055 | 975 | 975 | 965 | 965 | 985 |
| ABS (natural) | 2,265 | 2,300 | 2,330 | 2,330 | 2,380 | 2,340 | 2,330 | 2,230 | 2,250 | 2,210 | 2,230 | 2,250 | 2,250 |
| PC (clear bright) | 3,530 | 3,530 | 3,530 | 3,530 | 3,220 | 3,410 | 3,380 | 3,330 | 3,220 | 3,260 | 3,350 | 3,410 | 3,300 |
| PP (homo) | 1,540 | 1,350 | 1,400 | 1,400 | 1,400 | 1,460 | 1,510 | 1,410 | 1,380 | 1,400 | 1,420 | 1,460 | 1,470 |
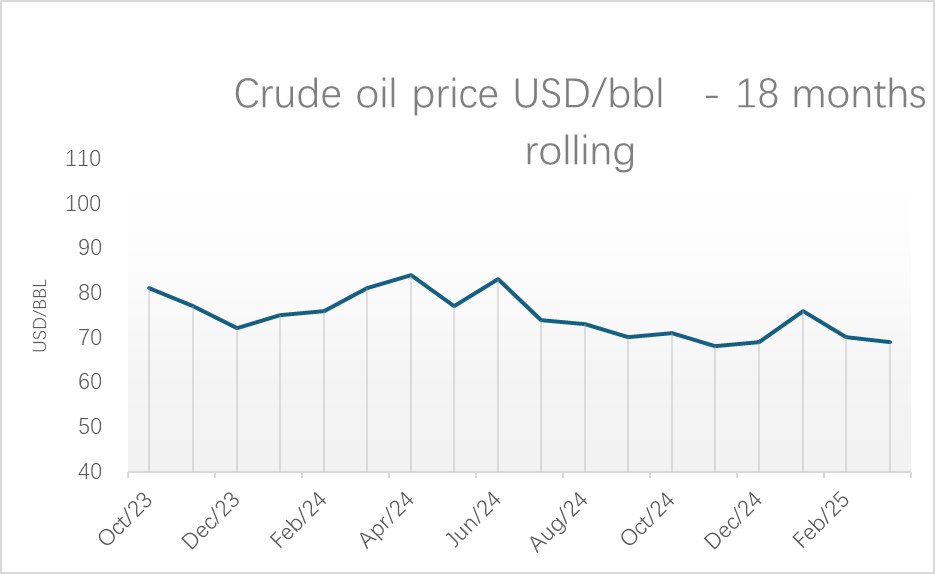
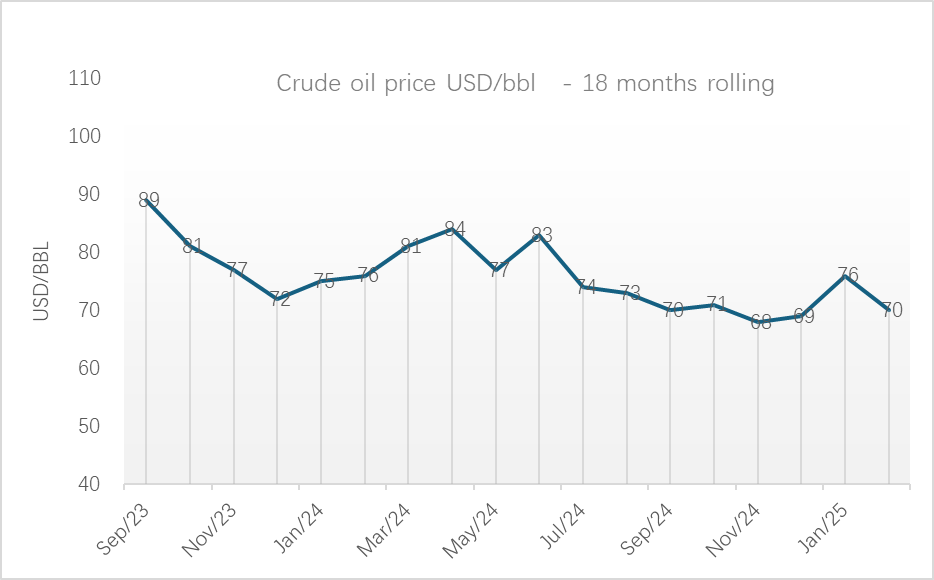
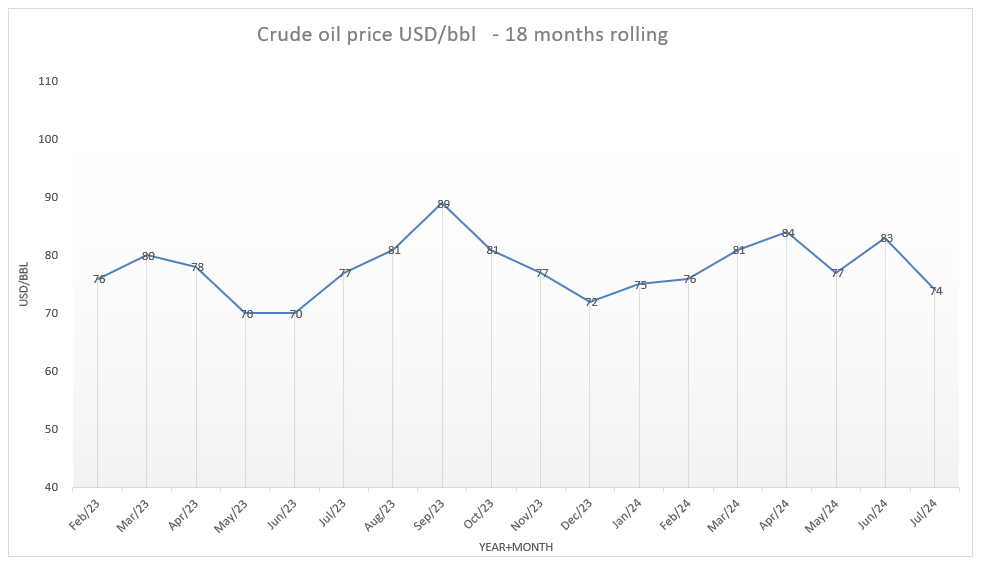
Oil: price declined from USD 70/bbl to USD 69/bbl in March(-1.4%), as the US-China trade war is expected to shrink the demand.
- Although Trump granted exclusions from steep tariffs on electronic products imported from China, he indicated that a new round of levies will be announced in due course, adding to continued uncertainty.
- OPEC+ decided to faster increase output.
- On the geopolitical front, signs of easing tensions between the U.S. and Iran may further boost global supply, particularly for key buyer China.
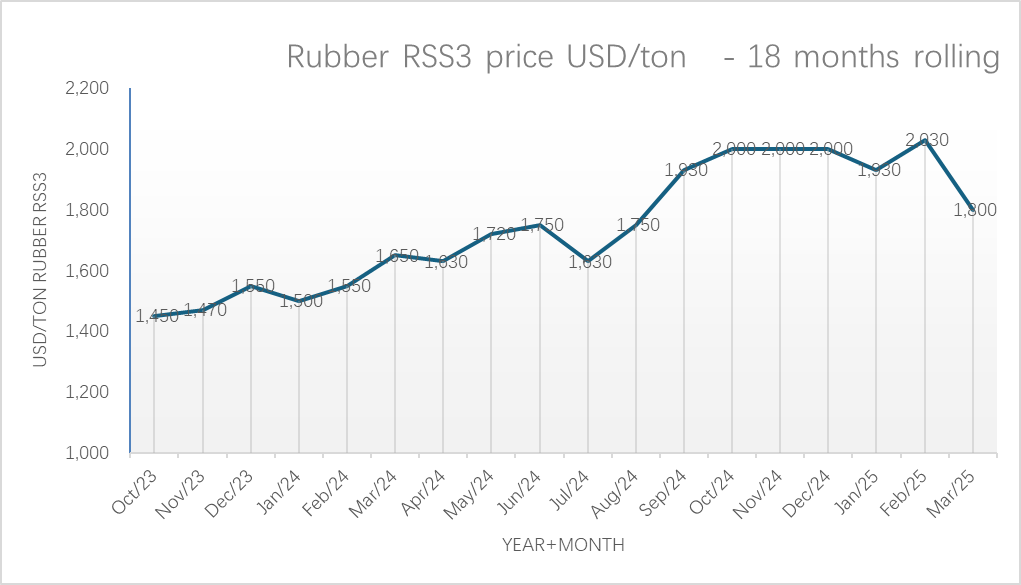
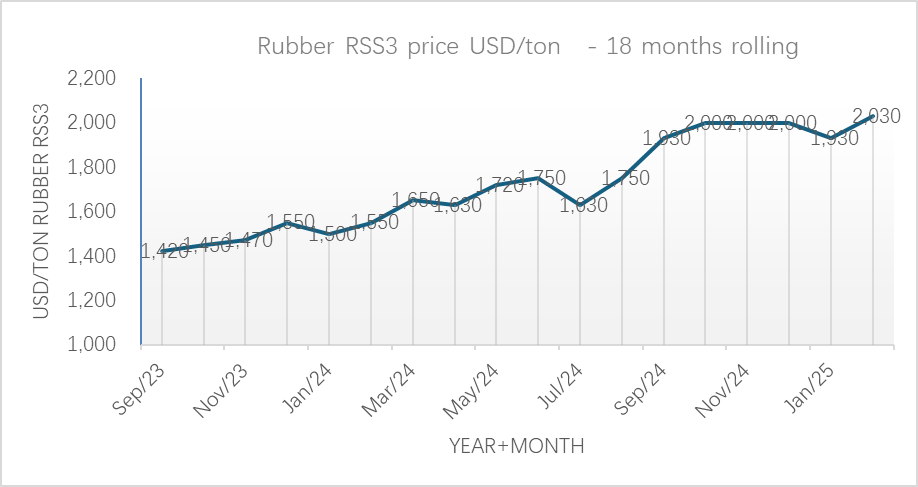
Rubber: Rubber: price increased from USD 1,930/ton to USD 2,030 in March(+5.2%).
Cotton: price drop from USD 1,500/ton to USD 1,430/ton in March(-4.7%, 1,470/ton as of today).
- Concerns about US trade policies.
- The USDA reported an increase in upland cotton net sales.
- Improved demand was noted, with expectations for strong sales from March through May.
- Overall, market sentiment showed signs of recovery after a prolonged bearish trend.
Packing material original: Euwid
| Indicator | Mar-24 | Apr-24 | May-24 | Jun-24 | Jul-24 | Aug-24 | Sep-24 | Oct-24 | Nov-24 | Dec-24 | Jan-25 | Feb-25 | Mar-25 |
| Crude oil (USD/bbl) | 81 | 84 | 77 | 83 | 74 | 73 | 70 | 71 | 68 | 69 | 76 | 70 | 69 |
| Kraftliner packaging material | 1,000 | 1,000 | 1,000 | 1,075 | 1,075 | 1,075 | 1,110 | 1,110 | 1,110 | 1,110 | 1,110 | 1,090 | 1,800 |
| Wellenstoff packaging material | 590 | 590 | 590 | 630 | 660 | 660 | 670 | 630 | 630 | 630 | 630 | 650 | 1,090 |
| Testliner II packaging material | 620 | 620 | 620 | 660 | 690 | 690 | 700 | 660 | 660 | 660 | 660 | 680 | 650 |
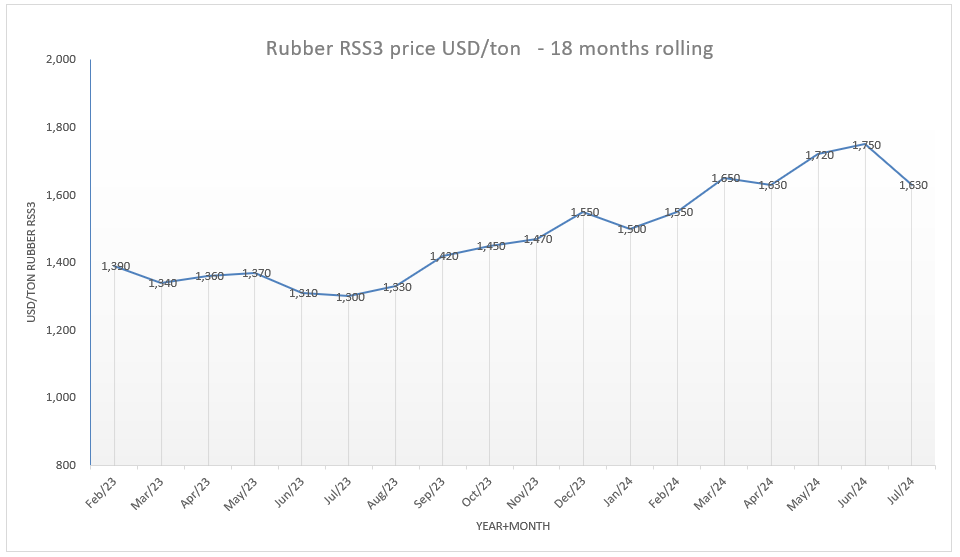
| Rubber RSS3 (USD/ton) | 1,650 | 1,630 | 1,720 | 1,750 | 1,630 | 1,750 | 1,930 | 2,000 | 2,000 | 2,000 | 1,930 | 2,030 | 680 |
| Cotton (input for CAB)
( USD/ton) |
2,000 | 1,830 | 1,730 | 1,540 | 1,500 | 1,500 | 1,560 | 1,560 | 1,560 | 1,540 | 1,500 | 1,430 | 1,400 |
Sea freight in March:
China – Europe: decreased from USD 1,700/20FT to USD 1,530/20FT (-10%)
Shanghai – Europe: decreased from USD 1,600/20FT to USD 1,360/20FT (-15%).
China – US Westcoast: decreased from USD 960/20FT to USD 810/20FT (-15.6%).
The USA’s new tariffs will reduce the worldwide trade market and affect the shipping freight a lot.
- USA tariffs on exports from a list of nearly 60 countries range from a level of 11% for Congo to 50% for Lesotho. These duties apply to all exports not loaded by April 9, 2025.
- As the Trump administration seems to target China, many companies in China shift accelerated a China+1 strategy. This trend was apparent in the increases in US trade with Mexico and Canada, and with alternatives in Asia like Vietnam, India, Taiwan and Bangladesh – at the expense of Chinese imports to the US which declined from 20% of total US imports in 2018 to 13% in 2024. This time though, the reciprocal tariffs make these alternatives less attractive. For example, goods from the below countries will meet accelerated tariffs:
Vietnam: 46%, India: 27%, Bangladesh: 37%, Cambodia: 49%
The US tariff policies will be on hold for 90 days to countries who have no retaliatory tariffs.
- The US tariffs on China import have increased to 145%, and 125% the other way. Both are expected to result in substantially lower ocean transport.
Currencies: Original: wwwoandacom
Currencies:
Currencies in March:
EUR/USD: increase from 1:1.04 to 1:1.08 (+3.85%).
EUR/JPY: increased from 1: 158.05 to 1:160.87 (-1.8%).
EUR/CNY: increased 1:7.56 to 1:7.82 (+3.4%).
USD/JPY: decreased from 1: 1:151.79 to 1:149.14. (-1.7%).
USD/TWD: a little moved from 1: 32.79 to 1:32.97 (+0.5%).
USD/CNY: slight decrease from 1:7.26 to 1:7.25 (-0.14%).
| Indicator | Mar-24 | Apr-24 | May-24 | Jun-24 | Jul-24 | Aug-24 | Sepr-24 | Oct-24 | Novr-24 | Dec-24 | Jan-25 | Feb-25 | Mar-25 |
| EUR/USD | 109 | 107 | 108 | 108 | 108 | 110 | 111 | 109 | 106 | 105 | 103 | 104 | 1.08 |
| EUR/JPY | 16271 | 16504 | 16836 | 17005 | 17112 | 16146 | 15887 | 16322 | 16310 | 16122 | 16202 | 15805 | 160.87 |
| EUR/CNY | 782 | 776 | 781 | 780 | 787 | 787 | 786 | 773 | 765 | 763 | 756 | 756 | 7.82 |
| EUR/TWD | 3441 | 3467 | 3490 | 3484 | 3540 | 3550 | 3547 | 3498 | 3436 | 3411 | 3400 | 3414 | 35.56 |
| USD/JPY | 14977 | 15394 | 15576 | 15804 | 15771 | 14624 | 14284 | 14977 | 15348 | 15391 | 15657 | 15179 | 149.14 |
| USD/NT$ | 3168 | 3234 | 3230 | 3239 | 3263 | 3223 | 3194 | 3210 | 3234 | 3257 | 3286 | 3279 | 32.97 |
| USD/CNY | 720 | 724 | 723 | 725 | 726 | 715 | 707 | 709 | 720 | 728 | 730 | 726 | 7.25 |
| EUR/VND | 26,850 | 26,990 | 27,500 | 27,370 | 27,500 | 27,600 | 27,350 | 27,280 | 26,930 | 26,620 | 26,150 | 26,400 | 27,540 |
| USD/THB | 3594 | 3675 | 3660 | 3671 | 3623 | 3471 | 3326 | 3335 | 3439 | 3413 | 3425 | 3375 | 33.80 |
Inflation Year on Year %, China Export rebates and China VAT
| Indicator | Mar-24 | Apr-24 | May-24 | Jun-24 | Jul-24 | Aug-24 | Sep-24 | Oct-24 | Nov-24 | Dec-24 | Jan-25 | Feb-25 | Mar-25 |
| Japan Inflation (CPI) YOY % | 2.70% | 2.50% | 2.80% | 2.80% | 2.80% | 3.00% | 2.50% | 2.30% | 2.90% | 3.60% | 4.00% | 3.70% | |
| Taiwan Inflation (CPI) YOY % | 2.14% | 1.95% | 2.24% | 2.42% | 2.52% | 2.36% | 1.82% | 1.69% | 2.08% | 2.10% | 2.66% | 1.58% | 2.29% |
| China Inflation (CPI) YOY % | 0.10% | 0.30% | 0.30% | 0.20% | 0.50% | 0.60% | 0.40% | 0.30% | 0.20% | 0.10% | 0.50% | -0.70% | -0.10% |
| Vietnam Inflation (CPI) YOY % | 3.97% | 4.40% | 4.44% | 4.34% | 4.36% | 3.45% | 2.63% | 2.89% | 2.77% | 2.94% | 3.63% | 2.91% | 3.31% |
| China Export rebates | 13% | 13% | 13% | 13% | 13% | 13% | 13% | 13% | 13% | 13% | 13% | 13% | 13% |
| China VAT | 13% | 13% | 13% | 13% | 13% | 13% | 13% | 13% | 13% | 13% | 13% | 13% | 13% |
LME Metal March 2025 Purchase indicators –Steel, Aluminum, Nickel, Cobalt, Lithium Hydroxide price and market overview
The Electric bike materials March 2025 purchase indicators are like below:
Moving commodities in March: Cobalt showed a major price increase of 56%, while nickel and copper rose by 4.5% and 4.8% respectively (in USD prices).
LME Metal Purchase indicators –Steel, Aluminum, Nickel, Cobalt, Lithium Hydroxide price and market overview
Original: www.lme.com
LME metals in 12 months: ( Lithium USD/kg, others USD/ton)
| Metal Materials | Apr-24 | May-24 | Jun-24 | Jul-24 | Aug-24 | Sep-24 | Oct-24 | Nov-24 | Dec-24 | Jan-25 | Feb-25 | Mar-25 |
| Steel LME Far East 3 months | 385 | 385 | 385 | 390 | 365 | 375 | 385 | 360 | 350 | 350 | 365 | 375 |
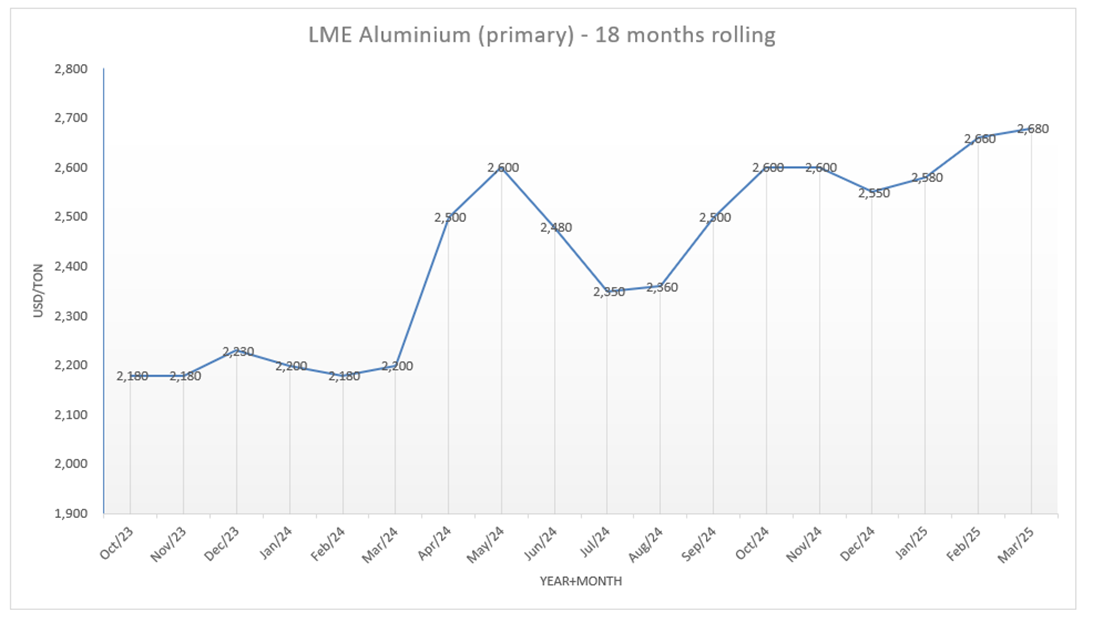
| Aluminium LME 3 months | 2,500 | 2,600 | 2,480 | 2,350 | 2,360 | 2,500 | 2,600 | 2,600 | 2,550 | 2,580 | 2,660 | 2,680 |
| Aluminium China local | 20,000 | 21,000 | 21,000 | 20,000 | 19,600 | 20,400 | 20,900 | 20,600 | 20,600 | 20,200 | 20,550 | 20,700 |
| Nickel | 18,600 | 19,800 | 17,500 | 16,400 | 16,300 | 16,300 | 17,000 | 15,700 | 15,500 | 15,400 | 15,400 | 16,100 |
| Copper | 9,400 | 10,100 | 9,600 | 9,400 | 9,000 | 9,300 | 9,500 | 9,000 | 8,950 | 8,950 | 9,300 | 9,750 |
| Cobalt (3 months buyer) | 27,600 | 26,900 | 26,300 | 25,900 | 24,500 | 23,600 | 23,800 | 23,800 | 23,800 | 23,800 | 21,000 | 32,800 |
| Lithium Hydroxide | 13.70 | 14.30 | 13.60 | 12.00 | 11.10 | 10.00 | 9.60 | 8.90 | 9.45 | 9.47 | 9.30 | 9.20 |
Steel: prices rose from USD 365/ton to USD 375/ton in March (+2.7%).
- The US raised its tariffs on China to 145% in the latest round of escalation in response to China’s 125% tariffs on US goods.
- Even though a portion of the US tariffs exclude steel, and steel trade between the two countries is a small fraction of global flows, the escalating trade war between China and the US pressured the outlook on construction and manufacturing for the world’s top ferrous metal consumer.
- The impact of tariffs on Chinese steel was lower than those in base metals, as economic aid from Beijing is set to support household consumption and property developers’ financial health.
- Beijing signaled it will cut capacity for steel mills as a reaction to protectionist trade from Vietnam, South Korea, and Brazil.
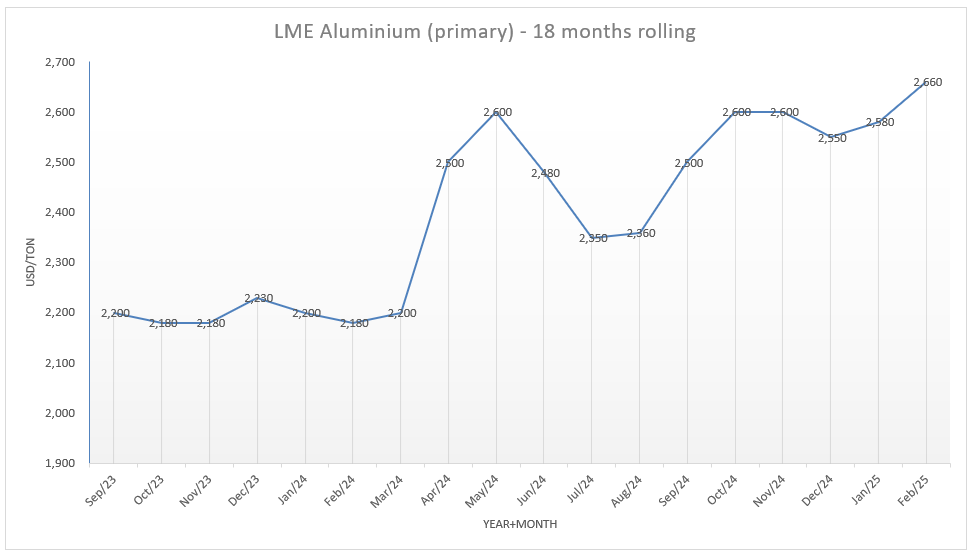
Aluminium: prices moved a little from USD 2,660/ton to USD 2,680/ton in March (+0.8%).
- The US has reinstated 25% tariffs on steel and aluminium from key trading partners, including Canada, Mexico, and the EU, while also imposing a 200% tariff on Russian aluminium.
- Major alumina producers in Guinea and Australia added new capacity to recover from disruptions last year.
- China produced 44 million tons of aluminium in 2024, a new record. However, supply growth in China is expected to slow as the current output level close to the output cap of 45 million tons.
Local aluminium prices in China rose from CNY 20,550/ton to CNY 20,700/ton in March(+0.8%).
Nickel: prices increased from USD 15.4K/ton to USD 16.1k/ton in March (+4.5%).
- China announced a 125% tariff on all US exported products, in response to recent US tariffs.
- Nickel stockpiles on LME have increased, with Chinese-processed Indonesian nickel now accounting for over 50% of LME inventories (11% at the start of 2024).
- Indonesia’s surging refined metal output is further saturating the market.
Cobalt: prices burst from USD 21K/ton to USD 32.8K/ton in March (+56.2%).
- Cobalt prices in China jumped on China’s strategic buying of cobalt and talks of extension of export ban from the Democratic Republic of Congo, the top supplier of the battery material.
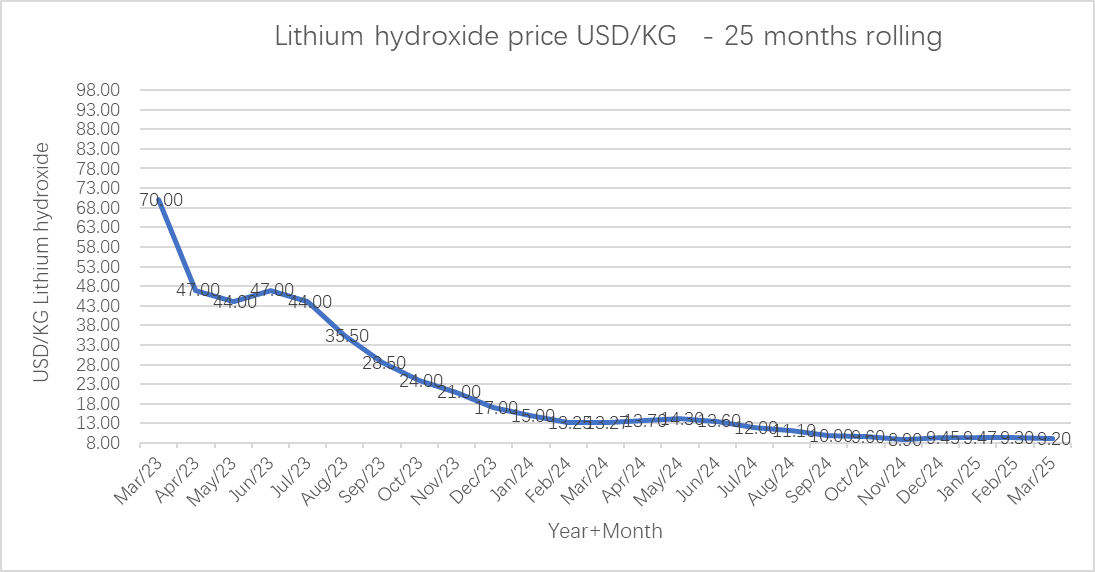
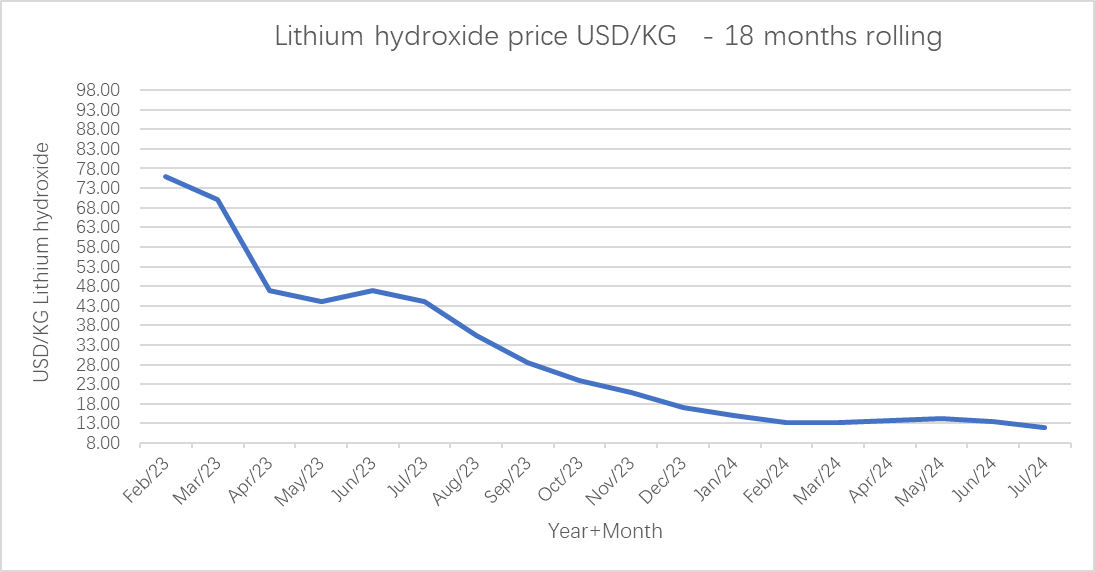
Lithium Hydroxide: price decreased from USD 9.3/kg to USD 9.2/kg in March (-1%).
- Sales in China rose by 38%, to 991,000 tons in March, but missed a forecast 1 million tons despite ongoing government subsidies that promote vehicle exchanges and energy transition technologies. Battery inventories remain elevated.
- Supply is not expected to slow as lithium miners are not willing to close operations in order to retain market share and business relationships with governments and battery producers.
Li Battery Raw Materials PriceTrends
Li Battery Raw Materials PriceTrends
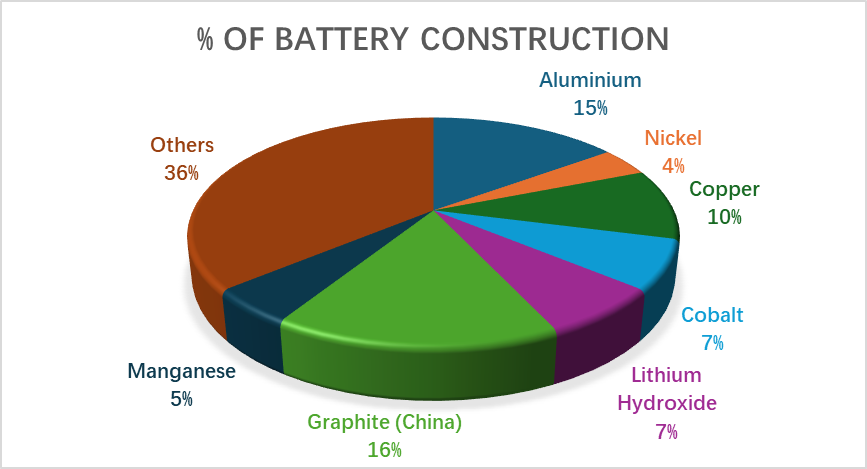
The present of batter construction
Li battery raw materials price trentds within
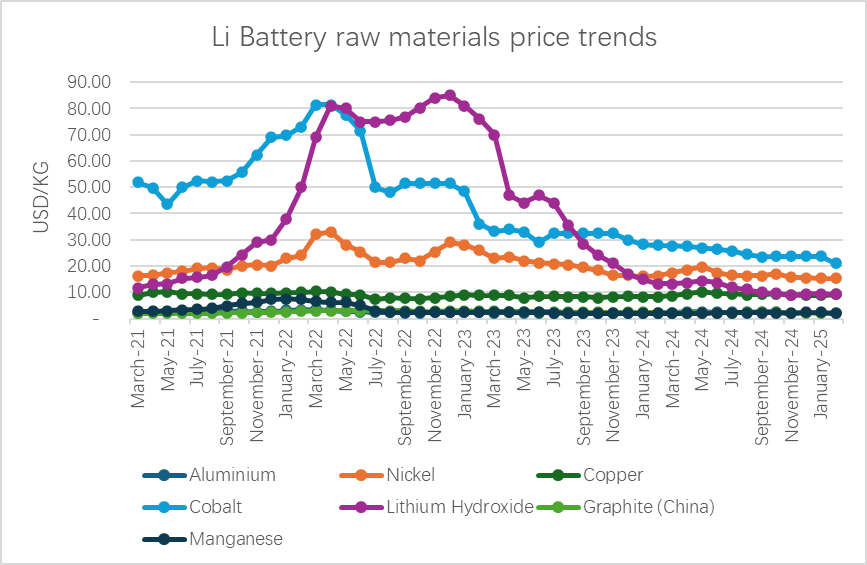
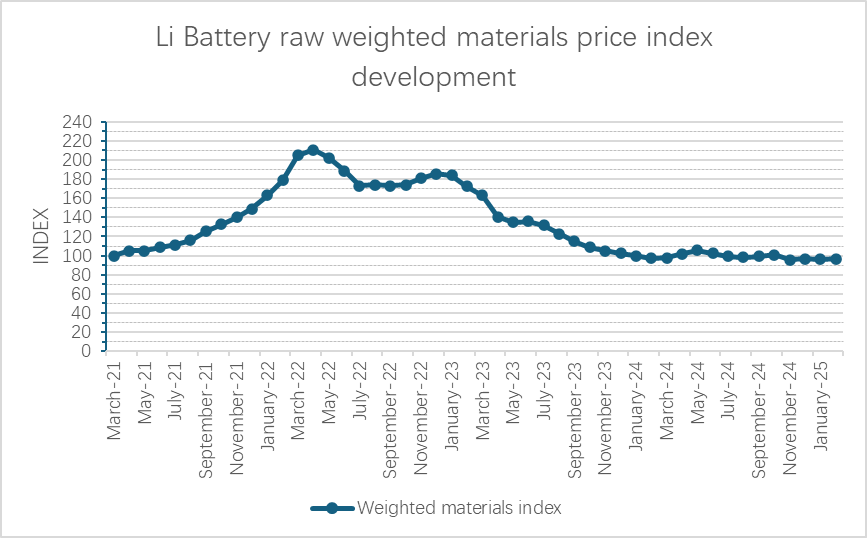
Li Battery raw materials price data
Unite: USD/kg
Source: www.lme.com https://businessanalytiq.com/
| Material | Aluminium | Nickel | Copper | Cobalt | Lithium Hydroxide | Graphite (China) | Manganese | Others |
| % of construction | 15% | 4% | 10% | 7% | 7% | 16% | 5% | 36% |
| March-21 | 2.20 | 16.20 | 8.90 | 51.80 | 11.75 | 1.95 | 2.80 | |
| April-21 | 2.40 | 16.50 | 10.00 | 49.80 | 13.00 | 1.96 | 2.85 | |
| May-21 | 2.45 | 17.50 | 10.20 | 43.60 | 13.25 | 1.91 | 2.97 | |
| June-21 | 2.50 | 18.00 | 9.35 | 50.00 | 15.25 | 1.92 | 3.32 | |
| July-21 | 2.50 | 19.20 | 9.50 | 52.50 | 15.75 | 1.94 | 3.52 | |
| August-21 | 2.65 | 19.40 | 9.30 | 52.00 | 16.50 | 2.09 | 3.86 | |
| September-21 | 2.90 | 18.50 | 9.20 | 52.50 | 19.70 | 2.19 | 4.95 | |
| October-21 | 2.70 | 20.00 | 9.90 | 55.70 | 24.20 | 2.22 | 5.80 | |
| November-21 | 2.60 | 20.50 | 9.60 | 62.30 | 29.00 | 2.37 | 6.18 | |
| December-21 | 2.80 | 20.00 | 9.65 | 69.00 | 30.00 | 2.44 | 7.41 | |
| January-22 | 3.10 | 23.00 | 9.80 | 69.75 | 38.00 | 2.58 | 7.47 | |
| February-22 | 3.30 | 24.00 | 10.00 | 73.00 | 50.00 | 2.68 | 7.36 | |
| March-22 | 3.50 | 32.00 | 10.30 | 81.36 | 69.00 | 2.94 | 6.54 | |
| April-22 | 3.10 | 33.00 | 10.10 | 81.36 | 81.00 | 2.90 | 6.27 | |
| May-22 | 2.80 | 28.00 | 9.30 | 77.60 | 80.00 | 2.89 | 6.27 | |
| June-22 | 2.50 | 25.50 | 9.00 | 71.50 | 75.00 | 2.92 | 5.04 | |
| July-22 | 2.40 | 21.50 | 7.40 | 50.00 | 75.00 | 2.94 | 2.88 | |
| August-22 | 2.43 | 21.50 | 8.00 | 48.00 | 75.50 | 3.02 | 2.45 | |
| September-22 | 2.23 | 23.00 | 7.80 | 51.50 | 76.80 | 2.92 | 2.40 | |
| October-22 | 2.22 | 22.00 | 7.60 | 51.50 | 80.20 | 2.85 | 2.42 | |
| November-22 | 2.35 | 25.50 | 8.00 | 51.50 | 84.00 | 2.84 | 2.39 | |
| December-22 | 2.40 | 29.00 | 8.40 | 51.50 | 85.00 | 2.93 | 2.32 | |
| January-23 | 2.55 | 28.00 | 9.10 | 48.50 | 81.00 | 2.95 | 2.38 | |
| February-23 | 2.40 | 26.00 | 8.90 | 36.00 | 76.00 | 2.80 | 2.43 | |
| March-23 | 2.28 | 23.00 | 8.80 | 33.30 | 70.00 | 2.76 | 2.51 | |
| April-23 | 2.30 | 23.50 | 8.80 | 34.00 | 47.00 | 2.67 | 2.37 | |
| May-23 | 2.27 | 22.00 | 8.00 | 33.00 | 44.00 | 2.63 | 2.35 | |
| June-23 | 2.18 | 21.25 | 8.40 | 29.00 | 47.00 | 2.59 | 2.35 | |
| July-23 | 2.15 | 20.80 | 8.40 | 32.50 | 44.00 | 2.52 | 2.10 | |
| August-23 | 2.15 | 20.50 | 8.38 | 32.50 | 35.50 | 2.46 | 2.04 | |
| September-23 | 2.20 | 19.50 | 8.30 | 32.50 | 28.50 | 2.36 | 2.04 | |
| October-23 | 2.18 | 18.29 | 7.95 | 32.50 | 24.00 | 2.32 | 2.04 | |
| November-23 | 2.18 | 16.50 | 8.25 | 32.50 | 21.00 | 2.26 | 2.07 | |
| December-23 | 2.23 | 16.40 | 8.45 | 30.00 | 17.00 | 2.30 | 2.03 | |
| January-24 | 2.20 | 16.10 | 8.35 | 28.20 | 15.00 | 2.32 | 2.02 | |
| February-24 | 2.18 | 16.20 | 8.35 | 27.90 | 13.25 | 2.27 | 2.01 | |
| March-24 | 2.20 | 17.50 | 8.73 | 27.78 | 13.27 | 2.24 | 1.97 | |
| April-24 | 2.50 | 18.60 | 9.40 | 27.60 | 13.70 | 2.15 | 1.98 | |
| May-24 | 2.60 | 19.80 | 10.10 | 26.90 | 14.30 | 2.19 | 1.91 | |
| June-24 | 2.48 | 17.50 | 9.60 | 26.30 | 13.60 | 2.21 | 2.12 | |
| July-24 | 2.35 | 16.40 | 9.40 | 25.90 | 12.00 | 2.25 | 2.21 | |
| August-24 | 2.36 | 16.30 | 9.00 | 24.50 | 11.10 | 2.29 | 2.18 | |
| September-24 | 2.50 | 16.30 | 9.30 | 23.60 | 10.00 | 2.34 | 2.13 | |
| October-24 | 2.60 | 17.00 | 9.50 | 23.80 | 9.60 | 2.35 | 2.11 | |
| November-24 | 2.6 | 15.70 | 9.00 | 23.8 | 8.9 | 2.10 | 2.08 | |
| December-24 | 2.55 | 15.50 | 8.95 | 23.8 | 9.45 | 2.11 | 2.46 | |
| January-25 | 2.58 | 15.40 | 8.95 | 23.8 | 9.47 | 2.05 | 2.45 | |
| February-25 | 2.66 | 15.40 | 9.30 | 21 | 9.3 | 2.14 | 1.98 |
February 2025 Purchase indicators of Plastics, Crude Oil, Rubber, Cotton, Sea freight, Currencies, Inflation Year, China Export rebates and China VAT
February 2025 Purchase indicators of Plastics, Crude Oil, Rubber, Cotton, Sea freight, Currencies, Inflation Year, China Export rebates and China VAT
The Electric bike industry February 2025 purchase indicators are like below:
Plastics LDPE (foil) increased by 6.6%, crude oil decreased by 7.9%, cotton decreased by 4.7%.
The container freight rates from China to Europe decreased around 19%~28%, and China to USA rates decreased by around 13%~18% in February.
Europe Plastics prices: LDPE (foil) increased 6.6% in February, other plastics prices remained stable.
Original: https://www.plasticportal.eu/ Unit: EUR/Ton
| Indicator | Mar.-24 | Apr.-24 | May-24 | Jun.-24 | Jul.-24 | Aug.-24 | Sep.-24 | Oct.-24 | Nov.-24 | Dec.-24 | Jan.-25 | Feb.-25 |
| PS (normal/clear) | 2,020 | 2,000 | 1,980 | 1,980 | 1,890 | 1,830 | 1,840 | 1,600 | 1,650 | 1,650 | 1,660 | 1,640 |
| HDPE (injection) | 1,430 | 1,310 | 1,340 | 1,340 | 1,390 | 1,280 | 1,460 | 1,360 | 1,240 | 1,320 | 1,300 | 1,310 |
| LLDPE (foil) | 1,440 | 1,310 | 1,290 | 1,290 | 1,210 | 1,320 | 1,350 | 1,290 | 1,190 | 1,230 | 1,300 | 1,340 |
| LDPE (foil) | 1,550 | 1,310 | 1,300 | 1,300 | 1,280 | 1,380 | 1,410 | 1,360 | 1,280 | 1,310 | 1,370 | 1,460 |
| PVC (foil) | 1,050 | 1,120 | 1,140 | 1,120 | 1,040 | 1,065 | 1,055 | 1,055 | 975 | 975 | 965 | 965 |
| ABS (natural) | 2,265 | 2,300 | 2,330 | 2,330 | 2,380 | 2,340 | 2,330 | 2,230 | 2,250 | 2,210 | 2,230 | 2,250 |
| PC (clear bright) | 3,530 | 3,530 | 3,530 | 3,530 | 3,220 | 3,410 | 3,380 | 3,330 | 3,220 | 3,260 | 3,350 | 3,410 |
| PP (homo) | 1,540 | 1,350 | 1,400 | 1,400 | 1,400 | 1,460 | 1,510 | 1,410 | 1,380 | 1,400 | 1,420 | 1,460 |
Oil: price declined from USD 76/bbl to USD 70/bbl in February (-7.9%, ~USD 67/bbl today).
- Prices came under pressure from the potential fallout of global trade shifts.
- While President Donald Trump eased some tariffs on Mexico and Canada until April 2, Canada’s retaliatory tariffs remain, and China’s also take countermeasures.
- OPEC+ plans to revive output in April, coinciding with prospects of a restart of the Kirkuk-Ceyhan pipeline and increased production at Kazakhstan’s Tengiz field.
- Russian President signaled interest in a Ukraine peace deal, raising the prospect of sanctions relief and higher Russian oil exports.
Rubber: Rubber: price increased from USD 1,930/ton to USD 2,030 in February (+5.2%, USD 2,030/ton today).
Cotton: price drop from USD 1,500/ton to USD 1,430/ton in February (-4.7%, 1,470/ton as of today).
- Concerns about US trade policies.
- The USDA reported an increase in upland cotton net sales.
- Improved demand was noted, with expectations for strong sales from March through May.
- Overall, market sentiment showed signs of recovery after a prolonged bearish trend.
| Indicator | Mar.-24 | Apr.-24 | May-24 | Jun.-24 | Jul.-24 | Aug.-24 | Sep.-24 | Oct.-24 | Nov.-24 | Dec.-24 | Jan.-25 | Feb.-25 |
| Crude oil (USD/bbl) | 81 | 84 | 77 | 83 | 74 | 73 | 70 | 71 | 68 | 69 | 76 | 70 |
| Rubber RSS3 (USD/ton) | 1,650 | 1,630 | 1,720 | 1,750 | 1,630 | 1,750 | 1,930 | 2,000 | 2,000 | 2,000 | 1,930 | 2,030 |
| Cotton (input for CAB)
( USD/ton) |
2,000 | 1,830 | 1,730 | 1,540 | 1,500 | 1,500 | 1,560 | 1,560 | 1,560 | 1,540 | 1,500 | 1,430 |
Sea freight in February:
China – Europe: decreased from USD 2,100/20FT to USD 1,700/20FT (-19%)
Shanghai – Europe: decreased from USD 2,230/20FT to USD 1,600/20FT (-28.3%).
China – US Westcoast: increased from USD 1,100/20FT to USD 960/20FT (-12.7%).
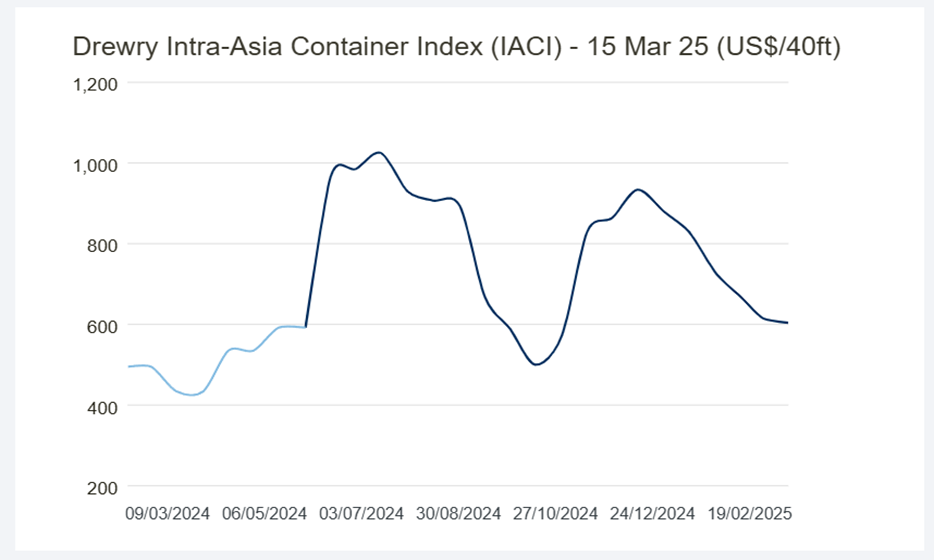
Intra-Asia: decreased from USD800/40FT to USD 670/40FT
- The combination of a seasonal slump in demand and the possible end of frontloading likely drove the sharp fall in transpacific ocean rates.
• Tariffs driving up inflation and negatively impacting consumer spending could also push down demand for ocean freight in H2.
Currencies: Original: www.oanda.com
Currencies:
EUR/USD: increase from 1:1.03 to 1:1.04(+0.97%).
EUR/JPY:decreased from 1: 162.02 to 1:158.05 (-2.5%).
EUR/CNY: stay at 1:7.56. (0%), increased to 1:7.84 today
USD/JPY: decreased from 1:156.57 to 1:151.79. (-3%).
USD/TWD: decreased from 1:32.86 to 1:32.79 (-0.2%).
USD/CNY: decrease from 1:7.3 to 1:7.26 (-0.55%).
| Indicator | Mar.-24 | Apr.-24 | May-24 | Jun.-24 | Jul.-24 | Aug.-24 | Sep.r-24 | Oct.-24 | Nov.r-24 | Dec.-24 | Jan.-25 | Feb.-25 |
| EUR/USD | 1.09 | 1.07 | 1.08 | 1.08 | 1.08 | 1.10 | 1.11 | 1.09 | 1.06 | 1.05 | 1.03 | 1.04 |
| EUR/JPY | 162.71 | 165.04 | 168.36 | 170.05 | 171.12 | 161.46 | 158.87 | 163.22 | 163.10 | 161.22 | 162.02 | 158.05 |
| EUR/CNY | 7.82 | 7.76 | 7.81 | 7.80 | 7.87 | 7.87 | 7.86 | 7.73 | 7.65 | 7.63 | 7.56 | 7.56 |
| EUR/TWD | 34.41 | 34.67 | 34.90 | 34.84 | 35.40 | 35.50 | 35.47 | 34.98 | 34.36 | 34.11 | 34.00 | 34.14 |
| USD/JPY | 149.77 | 153.94 | 155.76 | 158.04 | 157.71 | 146.24 | 142.84 | 149.77 | 153.48 | 153.91 | 156.57 | 151.79 |
| USD/NT$ | 31.68 | 32.34 | 32.30 | 32.39 | 32.63 | 32.23 | 31.94 | 32.10 | 32.34 | 32.57 | 32.86 | 32.79 |
| USD/CNY | 7.20 | 7.24 | 7.23 | 7.25 | 7.26 | 7.15 | 7.07 | 7.09 | 7.20 | 7.28 | 7.30 | 7.26 |
| EUR/VND | 26,850 | 26,990 | 27,500 | 27,370 | 27,500 | 27,600 | 27,350 | 27,280 | 26,930 | 26,620 | 26,150 | 26,400 |
| USD/THB | 35.94 | 36.75 | 36.60 | 36.71 | 36.23 | 34.71 | 33.26 | 33.35 | 34.39 | 34.13 | 34.25 | 33.75 |
Inflation Year on Year %, China Export rebates and China VAT
| Indicator | Mar.-24 | Apr.-24 | May-24 | Jun.-24 | Jul.-24 | Aug.-24 | Sep.-24 | Oct.-24 | Nov.-24 | Dec.-24 | Jan.-25 | Feb.-25 |
| Japan Inflation (CPI) YOY % | 2.70% | 2.50% | 2.80% | 2.80% | 2.80% | 3.00% | 2.50% | 2.30% | 2.90% | 3.60% | 4.00% | 3.70% |
| Taiwan Inflation (CPI) YOY % | 2.14% | 1.95% | 2.24% | 2.42% | 2.52% | 2.36% | 1.82% | 1.69% | 2.08% | 2.10% | 2.66% | 1.58% |
| China Inflation (CPI) YOY % | 0.10% | 0.30% | 0.30% | 0.20% | 0.50% | 0.60% | 0.40% | 0.30% | 0.20% | 0.10% | 0.50% | -0.70% |
| Vietnam Inflation (CPI) YOY % | 3.97% | 4.40% | 4.44% | 4.34% | 4.36% | 3.45% | 2.63% | 2.89% | 2.77% | 2.94% | 3.63% | 2.91% |
| China Export rebates | 13% | 13% | 13% | 13% | 13% | 13% | 13% | 13% | 13% | 13% | 13% | 13% |
| China VAT | 13% | 13% | 13% | 13% | 13% | 13% | 13% | 13% | 13% | 13% | 13% | 13% |
LME Metal February 2025 Purchase indicators –Steel, Aluminum, Nickel, Cobalt, Lithium Hydroxide price and market overview
LME Metal February 2025 Purchase indicators –Steel, Aluminum, Nickel, Cobalt, Lithium Hydroxide price and market overview
The Electric bike materials February 2025 purchase indicators are like below:
Big Moving commodities in February: steel and Copper rose by 4.3% and 3.1% respectively, cobalt deceased by 11.8%
LME Metal Purchase indicators –Steel, Aluminum, Nickel, Cobalt, Lithium Hydroxide price and market overview
Original: www.lme.com
LME metals in 12 months: ( Li USD/kg, others USD/ton)
| Metal Materials | Mar-24 | Apr-24 | May-24 | Jun-24 | Jul-24 | Aug-24 | Sep-24 | Oct-24 | Nov-24 | Dec-24 | Jan-25 | Feb-25 |
| Steel LME Far East 3 months | 385 | 385 | 385 | 385 | 390 | 365 | 375 | 385 | 360 | 350 | 350 | 365 |
| Aluminium LME 3 months | 2,200 | 2,500 | 2,600 | 2,480 | 2,350 | 2,360 | 2,500 | 2,600 | 2,600 | 2,550 | 2,580 | 2,660 |
| Aluminium China local | 19,160 | 20,000 | 21,000 | 21,000 | 20,000 | 19,600 | 20,400 | 20,900 | 20,600 | 20,600 | 20,200 | 20,550 |
| Nickel | 17,500 | 18,600 | 19,800 | 17,500 | 16,400 | 16,300 | 16,300 | 17,000 | 15,700 | 15,500 | 15,400 | 15,400 |
| Copper | 8,730 | 9,400 | 10,100 | 9,600 | 9,400 | 9,000 | 9,300 | 9,500 | 9,000 | 8,950 | 8,950 | 9,300 |
| Cobalt (3 months buyer) | 27,780 | 27,600 | 26,900 | 26,300 | 25,900 | 24,500 | 23,600 | 23,800 | 23,800 | 23,800 | 23,800 | 21,000 |
| Lithium Hydroxide | 13.27 | 13.70 | 14.30 | 13.60 | 12.00 | 11.10 | 10.00 | 9.60 | 8.90 | 9.45 | 9.47 | 9.30 |
Steel: prices rose from USD 350/ton to USD 365/ton in February (4.3%, ~USD 376/ton as of today).
- Beijing is expected to shrink capacity by 50 million tons this year to counter overcapacity, caused by lower construction demand from China’s property crisis and lower export ability.
- Vietnam put anti-dumping tariffs Chinese steel and South Korea, Brazil and Chile have pledged comparable measures (China exported a record-high 117 million tons in 2024, a 25% increase).
- In the meantime, the China domestic PMI is showing recovery (52.7 in February), contributing to cautious optimism.
Aluminium: price increased from USD 2,580/ton to USD 2,660/ton in February (+3.1%, ~USD 2,690/ton as of today).
- Renewed threats from the European Commission to put additional sanctions on Russian aluminium.
- Signals from the US to relax sanctions on Russia, easing growing concerns of low supply and lifting Rusal’s export outlook.
- Reduced Chinese aluminium exports after ending export stimulus measures, taking away a substantial price pressuring factor.
- On the demand side, a series of economic stimulus in China raises expectation of higher demand.
Local aluminium prices in China rose from CNY 20,200/ton to CNY 20,550/ton in February (+1.7%, ~CNY 20,770/ton as of today).
Nickel: prices remained stable at USD 15.4K/ton in February (0%, ~today USD 16.1K/ton).
- Indonesia considers reducing nickel mining quotas by 120 million tons in 2025, enough to reduce global supply by 35%. As this reduction hardly sparked a price reaction, it indicates that the market is still oversupplied and inventory at LME warehouses still remain 100% higher than one year ago (nearly 200 thousand tons finished product).
- Rising Chinese PMIs in China in February moved market from a bearish to a slightly positive sentiment.
Cobalt: prices declined from USD 23.8K/ton to USD 21K/ton in February, but reversed to USD 25.5k/ton in March (-11.8%, ~USD 25.5K/ton today).
Lithium Hydroxide: price decreased from USD 9.47/kg to USD 9.3/kg in February (-1.8%. today’s price is ~USD 9.09/kg), amid persistent pressure from an oversupplied market.
- EV sales in China rose by 17% annually in January and accounted for over 42% of total sales as Beijing rolled new fiscal benefits for NEV purchases (but battery inventories still remain high).
- Lithium miners don’t want to close operations to retain market share and business relationships with governments and battery producers.
- • Rio Tinto aims to enter the lithium market after buying US-based Arcadium Lithium for $6.7 billion.
The China Export Data of E-bike to worldwide
| No. | Period | PartnerCode | PartnerISO | CmdCode | AltQty | NetWgt | Fobvalue | PrimaryValue |
| 1 | 2023 | 840 | United States of America | 87116000 | 4564241 | 80922640 | 1288784794 | 1288784794 |
| 2 | 2023 | 528 | Netherlands | 87116000 | 827930 | 18413706 | 264415347 | 264415347 |
| 3 | 2023 | 616 | Poland | 87116000 | 525644 | 12542092 | 168786320 | 168786320 |
| 4 | 2023 | 392 | Japan | 87116000 | 333263 | 9604344 | 159955725 | 159955725 |
| 5 | 2023 | 276 | Germany | 87116000 | 565114 | 12026113 | 156907756 | 156907756 |
| 6 | 2023 | 124 | Canada | 87116000 | 321295 | 7829208 | 145769316 | 145769316 |
| 7 | 2023 | 410 | Rep. of Korea | 87116000 | 288139 | 8852440 | 134983519 | 134983519 |
| 8 | 2023 | 643 | Russian Federation | 87116000 | 375883 | 9750864 | 132362243 | 132362243 |
| 9 | 2023 | 360 | Indonesia | 87116000 | 715453 | 38350790 | 121881720 | 121881720 |
| 10 | 2023 | 699 | India | 87116000 | 440978 | 34010820 | 117009759 | 117009759 |
| 11 | 2023 | 36 | Australia | 87116000 | 264009 | 5540744 | 110159908 | 110159908 |
| 12 | 2023 | 250 | Metropolitan France | 87116000 | 349483 | 7303770 | 108493450 | 108493450 |
| 13 | 2023 | 792 | Turkey | 87116000 | 359089 | 24222117 | 107969129 | 107969129 |
| 14 | 2023 | 826 | United Kingdom | 87116000 | 463432 | 6863349 | 102971342 | 102971342 |
| 15 | 2023 | 704 | Viet Nam | 87116000 | 317246 | 13616793 | 92492449 | 92492449 |
| 16 | 2023 | 724 | Spain | 87116000 | 272647 | 5840133 | 84895738 | 84895738 |
| 17 | 2023 | 608 | Philippines | 87116000 | 195457 | 22311650 | 79378155 | 79378155 |
| 18 | 2023 | 764 | Thailand | 87116000 | 242619 | 12328398 | 75470227 | 75470227 |
| 19 | 2023 | 860 | Uzbekistan | 87116000 | 153336 | 20499683 | 64485473 | 64485473 |
| 20 | 2023 | 380 | Italy | 87116000 | 214980 | 4607178 | 61172695 | 61172695 |
| 21 | 2023 | 56 | Belgium | 87116000 | 245554 | 4423358 | 60328208 | 60328208 |
| 22 | 2023 | 484 | Mexico | 87116000 | 317725 | 9284274 | 60076475 | 60076475 |
| 23 | 2023 | 300 | Greece | 87116000 | 130941 | 3752360 | 57113792 | 57113792 |
| 24 | 2023 | 757 | Switzerland | 87116000 | 106126 | 2474346 | 50789865 | 50789865 |
| 25 | 2023 | 398 | Kazakhstan | 87116000 | 191255 | 8399856 | 42712878 | 42712878 |
| 26 | 2023 | 376 | Israel | 87116000 | 86765 | 2478801 | 42532155 | 42532155 |
| 27 | 2023 | 76 | Brazil | 87116000 | 174861 | 5605123 | 42434270 | 42434270 |
| 28 | 2023 | 784 | United Arab Emirates | 87116000 | 215300 | 4753418 | 41919954 | 41919954 |
| 29 | 2023 | 578 | Norway, excluding Svalbard and Jan Mayen | 87116000 | 59581 | 1442368 | 38793096 | 38793096 |
| 30 | 2023 | 554 | New Zealand | 87116000 | 40120 | 942245 | 30500397 | 30500397 |
| 31 | 2023 | 642 | Romania | 87116000 | 71423 | 3265118 | 22199074 | 22199074 |
| 32 | 2023 | 752 | Sweden | 87116000 | 77773 | 1646089 | 21635296 | 21635296 |
| 33 | 2023 | 682 | Saudi Arabia | 87116000 | 135510 | 2416373 | 21303621 | 21303621 |
| 34 | 2023 | 417 | Kyrgyzstan | 87116000 | 65316 | 4733406 | 20030393 | 20030393 |
| 35 | 2023 | 218 | Ecuador | 87116000 | 59582 | 4320129 | 19400547 | 19400547 |
| 36 | 2023 | 203 | Czechia | 87116000 | 55806 | 1679444 | 17686950 | 17686950 |
| 37 | 2023 | 591 | Panama | 87116000 | 59199 | 1843375 | 16809481 | 16809481 |
| 38 | 2023 | 705 | Slovenia | 87116000 | 46546 | 1248363 | 15448570 | 15448570 |
| 39 | 2023 | 170 | Colombia | 87116000 | 55956 | 1749157 | 15014941 | 15014941 |
| 40 | 2023 | 344 | China, Hong Kong SAR | 87116000 | 44780 | 827084 | 13600685 | 13600685 |
| 41 | 2023 | 40 | Austria | 87116000 | 29833 | 1261124 | 13326257 | 13326257 |
| 42 | 2023 | 368 | Iraq | 87116000 | 67795 | 2853529 | 13106032 | 13106032 |
| 43 | 2023 | 604 | Peru | 87116000 | 38711 | 2551321 | 12771949 | 12771949 |
| 44 | 2023 | 458 | Malaysia | 87116000 | 47485 | 1481644 | 12461802 | 12461802 |
| 45 | 2023 | 418 | Lao People’s Dem. Rep. | 87116000 | 46351 | 2939042 | 12086264 | 12086264 |
| 46 | 2023 | 152 | Chile | 87116000 | 44050 | 1494890 | 11251957 | 11251957 |
| 47 | 2023 | 191 | Croatia | 87116000 | 31580 | 1082607 | 10345855 | 10345855 |
| 48 | 2023 | 116 | Cambodia | 87116000 | 49566 | 2526866 | 10092841 | 10092841 |
| 49 | 2023 | 32 | Argentina | 87116000 | 26504 | 836479 | 9562708 | 9562708 |
| 50 | 2023 | 246 | Finland | 87116000 | 19576 | 714628 | 9497348 | 9497348 |
| 51 | 2023 | 192 | Cuba | 87116000 | 12011 | 2088468 | 9215328 | 9215328 |
| 52 | 2023 | 702 | Singapore | 87116000 | 13289 | 524772 | 9171630 | 9171630 |
| 53 | 2023 | 804 | Ukraine | 87116000 | 23156 | 1379451 | 8370997 | 8370997 |
| 54 | 2023 | 858 | Uruguay | 87116000 | 51366 | 763516 | 8016498 | 8016498 |
| 55 | 2023 | 348 | Hungary | 87116000 | 25145 | 1500906 | 7721119 | 7721119 |
| 56 | 2023 | 620 | Portugal | 87116000 | 27399 | 1123193 | 7526902 | 7526902 |
| 57 | 2023 | 440 | Lithuania | 87116000 | 17064 | 596573 | 6955781 | 6955781 |
| 58 | 2023 | 100 | Bulgaria | 87116000 | 16771 | 953653 | 6442203 | 6442203 |
| 59 | 2023 | 104 | Myanmar | 87116000 | 19138 | 1583381 | 6306592 | 6306592 |
| 60 | 2023 | 586 | Pakistan | 87116000 | 23509 | 1436610 | 5772783 | 5772783 |
| 61 | 2023 | 208 | Denmark | 87116000 | 21095 | 536947 | 5726241 | 5726241 |
| 62 | 2023 | 204 | Benin | 87116000 | 5377 | 671269 | 5650279 | 5650279 |
| 63 | 2023 | 818 | Egypt | 87116000 | 20759 | 649694 | 5302425 | 5302425 |
| 64 | 2023 | 524 | Nepal | 87116000 | 6795 | 994332 | 5028101 | 5028101 |
| 65 | 2023 | 158 | Taiwan, Province of China | 87116000 | 14591 | 604755 | 4864573 | 4864573 |
| 66 | 2023 | 768 | Togo | 87116000 | 4547 | 547709 | 4822406 | 4822406 |
| 67 | 2023 | 710 | South Africa | 87116000 | 17007 | 536029 | 4805861 | 4805861 |
| 68 | 2023 | 703 | Slovakia | 87116000 | 8713 | 322687 | 4784116 | 4784116 |
| 69 | 2023 | 144 | Sri Lanka | 87116000 | 8654 | 482679 | 4425084 | 4425084 |
| 70 | 2023 | 504 | Morocco | 87116000 | 9727 | 527037 | 4322155 | 4322155 |
| 71 | 2023 | 762 | Tajikistan | 87116000 | 10798 | 840672 | 4252949 | 4252949 |
| 72 | 2023 | 328 | Guyana | 87116000 | 13956 | 678987 | 3985433 | 3985433 |
| 73 | 2023 | 446 | China, Macao SAR | 87116000 | 1850 | 195727 | 3265702 | 3265702 |
| 74 | 2023 | 112 | Belarus | 87116000 | 9041 | 504148 | 2839324 | 2839324 |
| 75 | 2023 | 372 | Ireland | 87116000 | 16162 | 212966 | 2654522 | 2654522 |
| 76 | 2023 | 50 | Bangladesh | 87116000 | 6370 | 603962 | 2565554 | 2565554 |
| 77 | 2023 | 352 | Iceland | 87116000 | 3503 | 119185 | 2563887 | 2563887 |
| 78 | 2023 | 512 | Oman | 87116000 | 9028 | 275287 | 2523205 | 2523205 |
| 79 | 2023 | 388 | Jamaica | 87116000 | 4067 | 255571 | 2324294 | 2324294 |
| 80 | 2023 | 566 | Nigeria | 87116000 | 9944 | 698629 | 2263139 | 2263139 |
| 81 | 2023 | 404 | Kenya | 87116000 | 2628 | 298839 | 2116598 | 2116598 |
| 82 | 2023 | 862 | Venezuela | 87116000 | 10524 | 274933 | 2079439 | 2079439 |
| 83 | 2023 | 422 | Lebanon | 87116000 | 5284 | 419561 | 1946030 | 1946030 |
| 84 | 2023 | 638 | Reunion (Overseas France) | 87116000 | 4449 | 140409 | 1914826 | 1914826 |
| 85 | 2023 | 48 | Bahrain | 87116000 | 10989 | 282514 | 1863258 | 1863258 |
| 86 | 2023 | 634 | Qatar | 87116000 | 5761 | 131218 | 1822650 | 1822650 |
| 87 | 2023 | 688 | Serbia | 87116000 | 5271 | 263378 | 1812948 | 1812948 |
| 88 | 2023 | 834 | United Rep. of Tanzania | 87116000 | 3785 | 499875 | 1752840 | 1752840 |
| 89 | 2023 | 600 | Paraguay | 87116000 | 14654 | 195609 | 1670820 | 1670820 |
| 90 | 2023 | 320 | Guatemala | 87116000 | 3897 | 144218 | 1598153 | 1598153 |
| 91 | 2023 | 188 | Costa Rica | 87116000 | 3293 | 161465 | 1577980 | 1577980 |
| 92 | 2023 | 414 | Kuwait | 87116000 | 8698 | 210435 | 1502620 | 1502620 |
| 93 | 2023 | 214 | Dominican Rep. | 87116000 | 3306 | 188872 | 1494769 | 1494769 |
| 94 | 2023 | 258 | French Polynesia | 87116000 | 2552 | 108475 | 1355112 | 1355112 |
| 95 | 2023 | 288 | Ghana | 87116000 | 3554 | 252143 | 1343432 | 1343432 |
| 96 | 2023 | 462 | Maldives | 87116000 | 1854 | 284912 | 1297677 | 1297677 |
| 97 | 2023 | 8 | Albania | 87116000 | 6828 | 144486 | 1263269 | 1263269 |
| 98 | 2023 | 740 | Suriname | 87116000 | 5708 | 323197 | 1183850 | 1183850 |
| 99 | 2023 | 196 | Cyprus | 87116000 | 2035 | 99785 | 1171670 | 1171670 |
| 100 | 2023 | 233 | Estonia | 87116000 | 1606 | 58063 | 1126793 | 1126793 |
Purchase indicators of Plastics, Crude Oil, Rubber, Cotton, Sea freight, Currencies, Inflation Year, China Export rebates and China VAT
Europe Plastics prices: In July, PS (normal/clear) -4.5%, LLDPE (foil) -6.2%, PVC (foil) -7.1%, PC (clear bright) -8.8%. Original: https://www.plasticportal.eu/ Unit: EUR/Ton
| Indicator | Aug-23 | Sep-23 | Oct-23 | Nov-23 | Dec-23 | Jan-24 | Feb-24 | Mar-24 | Apr-24 | May-24 | Jun-24 | Jul-24 |
| PS (normal/clear) | 1,630 | 1,770 | 1,850 | 1,700 | 1,610 | 1,600 | 1,800 | 2,020 | 2,000 | 1,980 | 1,980 | 1,890 |
| HDPE (injection) | 1,260 | 1,350 | 1,430 | 1,340 | 1,310 | 1,250 | 1,310 | 1,430 | 1,310 | 1,340 | 1,340 | 1,390 |
| LLDPE (foil) | 1,270 | 1,380 | 1,470 | 1,390 | 1,370 | 1,290 | 1,370 | 1,440 | 1,310 | 1,290 | 1,290 | 1,210 |
| LDPE (foil) | 1,490 | 1,560 | 1,670 | 1,560 | 1,520 | 1,280 | 1,470 | 1,550 | 1,310 | 1,300 | 1,300 | 1,280 |
| PVC (foil) | 1,280 | 1,300 | 1,340 | 1,240 | 1,220 | 1,240 | 1,040 | 1,050 | 1,120 | 1,140 | 1,120 | 1,040 |
| ABS (natural) | 1,870 | 1,970 | 2,000 | 1,860 | 1,820 | 2,200 | 2,130 | 2,265 | 2,300 | 2,330 | 2,330 | 2,380 |
| PC (clear bright) | 4,050 | 4,050 | 4,150 | 4,030 | 3,980 | 3,600 | 3,530 | 3,530 | 3,530 | 3,530 | 3,530 | 3,220 |
| PP (homo) | 1,230 | 1,320 | 1,410 | 1,300 | 1,290 | 1,350 | 1,450 | 1,540 | 1,350 | 1,400 | 1,400 | 1,400 |
Crude Oil: price dropped from USD 83/bbl to USD 74/bbl in July (-10.8%).
- Increase in oil production from U.S. and some OPEC+ members which boost supply.
- Slower economic growth (China, Europe), leading to weaker oil demand concerns.
- The USA released additional crude oil from their strategic reserves to stabilize or reduce prices.
- Fears of a potential regional war (Israel, Lebanon, Iran) and stopped production due to political instability (e.g. Lybia’s largest oil field, Sharara, due to anti-government protests and security issues) give some counterweight the price decline.
Rubber: declined from USD 1,750/ton to USD 1,630/ton in July (-6.9%, USD 1,690/ton today), as concerns over global tight supplies.
- China’s manufacturing activity fell for a third consecutive month in July, depressing demand outlooks.
Cotton: Declined from USD 1,540/ton to USD 1,500/ton in July (-2.6%, 1,450/ton as of today) due to falling oil prices and heavy selling pressure in agricultural commodities.
- Global cotton production is projected to grow steadily, reaching 29 million tons by 2033, a 17% increase from the 2021-23 base period, with India accounting for 38%, United States at 27% and Brazil at 21% (OECD-FAO Agricultural Outlook 2024-2033′ report).
| Indicator | Aug-23 | Sep-23 | Oct-23 | Nov-23 | Dec-23 | Jan-24 | Feb-24 | Mar-24 | Apr-24 | May-24 | Jun-24 | Jul-24 |
| Crude oil (USD/bbl) | 81 | 89 | 81 | 77 | 72 | 75 | 76 | 81 | 84 | 77 | 83 | 74 |
| Rubber RSS3 (USD/ton) | 1,330 | 1,420 | 1,450 | 1,470 | 1,550 | 1,500 | 1,550 | 1,650 | 1,630 | 1,720 | 1,750 | 1,630 |
| Cotton (input for CAB)
( USD/ton) |
1,880 | 1,880 | 1,850 | 1,750 | 1,760 | 1,830 | 2,000 | 2,000 | 1,830 | 1,730 | 1,540 | 1,500 |
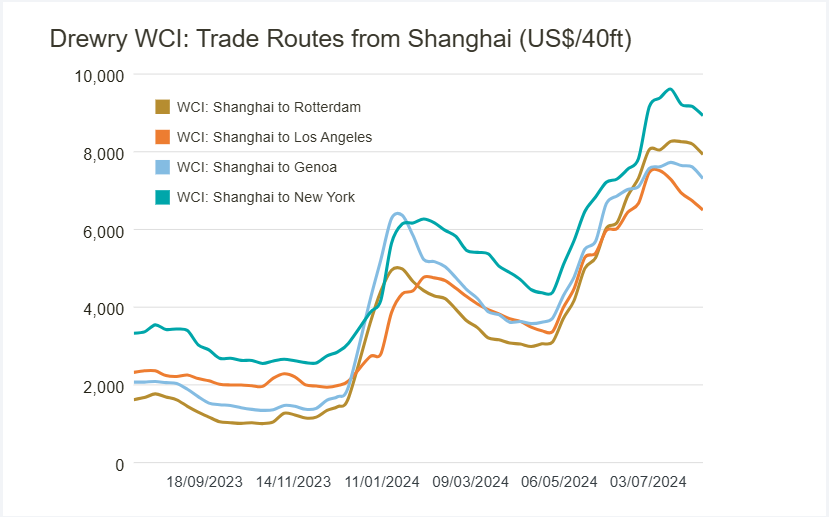
Sea freight indicators: Original: Original: https://www.drewry.co.uk/
Shanghai – Rotterdam: increased from USD 6,500/40FT to USD 8,000/40FT (+23%)
Shanghai – Los Angeles(A/C): increased from USD 6,200/40FT to USD 7,300/40FT (+17.7%).
- The US National Retail Federation point out that the consumer goods shipments will peak in August and the peak season to Europe might be earlier. Asia-Europe utilization levels have slipped recently. Besides the continued Red Sea diversions mean longer transit times and a need for earlier departures (end September instead of 2nd half of October).
- Despite volumes likely reaching their peak, there is still no significant congestion at destination hubs from increased import traffic.
- Congestion is still a factor in Singapore and has led to some spillover to Malaysia. But overall delays have decreased, with vessel wait times under two days in Singapore.
Currencies: Original: www.oanda.com
EUR/USD: remained at 1:1.08 (0%) in July.
EUR/JPY: increased a bit from 1:170.05 to 1:171.12 (+0.6%).
EUR/CNY: increased from 1:7.80 to 1:7.87. (+0.9%).
USD/JPY: decreased from 1: 158.04 to 1:157.71. (-0.2%).
USD/TWD: increased from 1: 32.39 to 1:32.63 (+0.7%).
USD/CNY: increase from 1:7.25 to 1:7.26. (+0.1%).
| Indicator | Aug-23 | Sep-23 | Oct-23 | Nov-23 | Dec-23 | Jan-24 | Feb-24 | Mar-24 | Apr-24 | May-24 | Jun-24 | Jul-24 |
| EUR/USD | 1.09 | 1.07 | 1.06 | 1.08 | 1.09 | 1.09 | 1.08 | 1.09 | 1.07 | 1.08 | 1.08 | 1.08 |
| EUR/JPY | 157.89 | 157.77 | 157.95 | 161.99 | 157.03 | 159.35 | 161.20 | 162.71 | 165.04 | 168.36 | 170.05 | 171.12 |
| EUR/CNY | 7.89 | 7.78 | 7.69 | 7.79 | 7.76 | 7.75 | 7.72 | 7.82 | 7.76 | 7.81 | 7.80 | 7.87 |
| EUR/TWD | 34.70 | 34.20 | 34.10 | 34.48 | 34.08 | 34.01 | 33.88 | 34.41 | 34.67 | 34.90 | 34.84 | 35.40 |
| USD/JPY | 144.74 | 147.72 | 149.54 | 149.84 | 144.08 | 146.06 | 149.44 | 149.77 | 153.94 | 155.76 | 158.04 | 157.71 |
| USD/NT$ | 31.81 | 32.02 | 32.28 | 31.90 | 31.27 | 31.18 | 31.42 | 31.68 | 32.34 | 32.30 | 32.39 | 32.63 |
| USD/CNY | 7.23 | 7.29 | 7.28 | 7.21 | 7.12 | 7.10 | 7.16 | 7.20 | 7.24 | 7.23 | 7.25 | 7.26 |
| EUR/VND | 26,000 | 25,850 | 25,850 | 26,300 | 26,460 | 26,700 | 26,390 | 26,850 | 26,990 | 27,500 | 27,370 | 27,500 |
| USD/THB | 35.00 | 35.79 | 36.47 | 35.44 | 34.97 | 35.15 | 35.84 | 35.94 | 36.75 | 36.60 | 36.71 | 36.23 |
Inflation Year on Year %, China Export rebates and China VAT
| Indicator | Aug-23 | Sep-23 | Oct-23 | Nov-23 | Dec-23 | Jan-24 | Feb-24 | Mar-24 | Apr-24 | May-24 | Jun-24 | Jul-24 |
| Japan Inflation (CPI) YOY % | 3.20% | 3.00% | 3.30% | 2.80% | 2.60% | 2.20% | 2.80% | 2.70% | 2.50% | 2.80% | 2.80% | |
| Taiwan Inflation (CPI) YOY % | 2.52% | 2.93% | 3.05% | 2.90% | 2.71% | 1.79% | 3.08% | 2.14% | 1.95% | 2.24% | 2.42% | |
| China Inflation (CPI) YOY % | 0.10% | 0.00% | -0.20% | -0.50% | -0.30% | -0.80% | 0.70% | 0.10% | 0.30% | 0.30% | 0.20% | |
| Vietnam Inflation (CPI) YOY % | 2.96% | 3.66% | 3.59% | 3.45% | 3.58% | 3.37% | 3.98% | 3.97% | 4.40% | 4.44% | 4.34% | 4.36% |
| China Export rebates | 13% | 13% | 13% | 13% | 13% | 13% | 13% | 13% | 13% | 13% | 13% | 13% |
| China VAT | 13% | 13% | 13% | 13% | 13% | 13% | 13% | 13% | 13% | 13% | 13% | 13% |
LME Metal Purchase indicators –Steel, Aluminum, Nickel, Cobalt, Lithium Hydroxide price and market overview
The Electric bike materials purchase indicators are like below:
Moving commodities in July: Aluminium -5.2%, Nickel -6.3%, Lithium Hydroxide -11.8% and plastics in general (LLDPE (foil), PVC (foil), PC (clear bright) on average -7.4%). Crude oil (-10.8%) and rubber (-6.9%) dropped as well. Other materials moved within narrow ranges and the same applied to main currency pairs. Container shipping rates continued to rise from already elevated levels, Shanghai – EU+9.8% and China-EU +27%.
LME Metal Purchase indicators –Steel, Aluminum, Nickel, Cobalt, Lithium Hydroxide price and market overview
Original: www.lme.com
LME metals in 12 months: (USD/Ton)
| Indicator | Aug-23 | Sep-23 | Oct-23 | Nov-23 | Dec-23 | Jan-24 | Feb-24 | Mar-24 | Apr-24 | May-24 | Jun-24 | Jul-24 |
| Steel LME Far East 3 months | 375 | 380 | 370 | 400 | 415 | 410 | 405 | 385 | 385 | 385 | 385 | 390 |
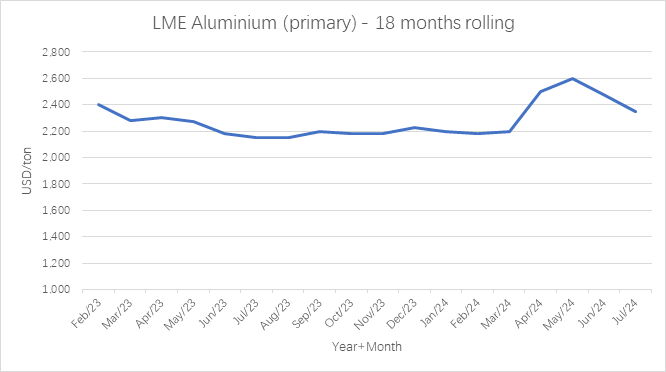
| Aluminium LME 3 months | 2,150 | 2,200 | 2,180 | 2,180 | 2,230 | 2,200 | 2,180 | 2,200 | 2,500 | 2,600 | 2,480 | 2,350 |
| Aluminium China local | 18,600 | 19,170 | 19,000 | 18,800 | 18,920 | 18,900 | 18,800 | 19,160 | 20,000 | 21,000 | 21,000 | 20,000 |
| Nickel | 20,500 | 19,500 | 18,290 | 16,500 | 16,400 | 16,100 | 16,200 | 17,500 | 18,600 | 19,800 | 17,500 | 16,400 |
| Copper | 8,380 | 8,300 | 7,950 | 8,250 | 8,450 | 8,350 | 8,350 | 8,730 | 9,400 | 10,100 | 9,600 | 9,400 |
| Cobalt (3 months buyer) | 32,500 | 32,500 | 32,500 | 32,500 | 30,000 | 28,200 | 27,900 | 27,780 | 27,600 | 26,900 | 26,300 | 25,900 |
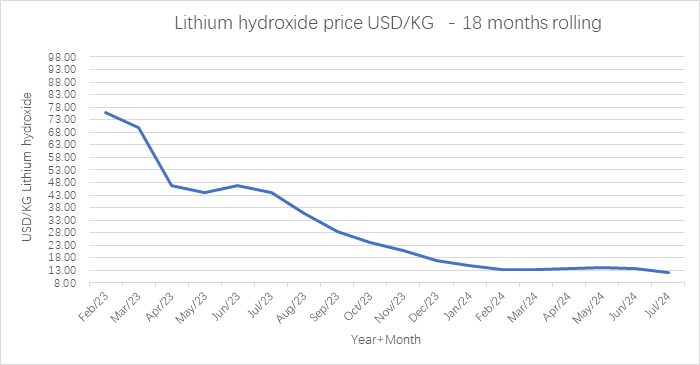
| Lithium Hydroxide | 35500 | 28500 | 24000 | 21000 | 17000 | 15000 | 13250 | 13270 | 13700 | 14300 | 13600 | 12000 |
Steel: prices hardly moved (from USD 385/ton to USD 390/ton in July, and to ~USD 371/ton as of today), as news on continued demand weakness persisted in China:
- China mandated new (higher) material quality standards starting in September, driving mills and traders to flood the market with old stockpiles.
- China’s economy grew less than expected in Q2, and home prices slumped the most in nine years. The data reduced the global demand and Chinese economic output.
Aluminium: price dropped from USD 2,480/ton to USD 2,350/ton in July (-5.2%, ~USD 2,200/ton as of today), hovering near their lowest in five months.
- Aluminum output in China rose by 6.2% y-o-y in June to 3.76 million tons, the highest since November 2014.
- China economic data pointed at continued depressed domestic demand. Manufacturing PMI pointed to a third straight decline in July.
- Chinese factories struggle offset the lower domestic demand with exports.
Aluminium local prices in China decreased from CNY 21,000/ton to CNY 20,000/ton in July (-4.8%, ~CNY 18,750/ton as of today).
Nickel: price dropped from USD 17.5K/ton to USD 16.4K/ton in July (-6.3%, today USD 16K/ton).
- Rapid expansion of Indonesia’s nickel industry has driven the world market to oversupply.
- A temporary rise earlier this year was driven by geopolitical tensions and sanctions is now unwinding.
- Global nickel inventory forecasts predict a four-year high in 2024.
- As a result of lower prices, BHP Group Ltd. has stopped 2 major nickel mining projects in Western Australia.
Cobalt: price decreased slightly from USD 26.3K/ton to USD 25.9k/ton in July (-1.5%, ~USD 25.6K/ton today).
Lithium Hydroxide: price declined from USD 13.6/kg to USD 12/kg in July (-11.8%, ~USD 11.3/kg today), the lowest in over three years.
- Lithium miners and producers continued to expand capacity and seek new reserves (expected output growth is close to 50% this year).
- Chile announced to double their output over the next decade.
- The EU charges 38% and USA charges 100% import tax on Chinese EV, causing a 15% export drop in June.
E-scooter trial launched for West of England
A 12-month trial of e-scooters is being rolled out across parts of the West of England.
Hop-on hop-off e-scooters run by Voi Technology Ltd will be available in Bristol, Bath and South Gloucestershire to help residents and visitors get around.
The e-scooters will be capped to a maximum speed of 15.5mph and cannot be used on pavements.
The trial is expected to begin later this month.
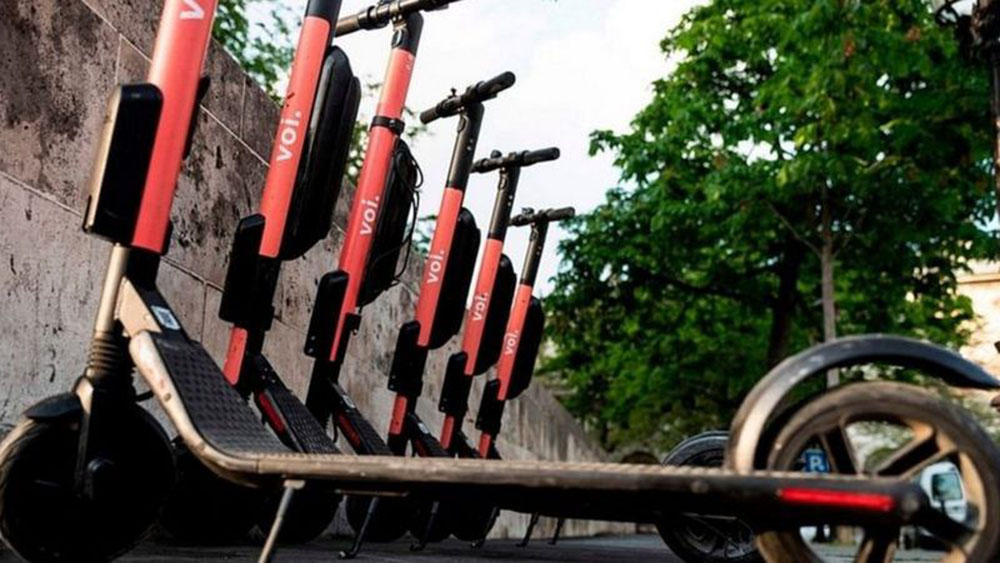
The Swedish company will provide the e-scooters for short or longer-term rental allowing residents to take them home if required.
The trial is being led by the West of England Combined Authority (WECA) in partnership with Bath & North East Somerset, Bristol and South Gloucestershire councils, with the cost of rides and unlocking due to be announced at a later date.
The Department of Transport passed legislation earlier this year to accelerate the deployment of e-scooter trials across the UK.
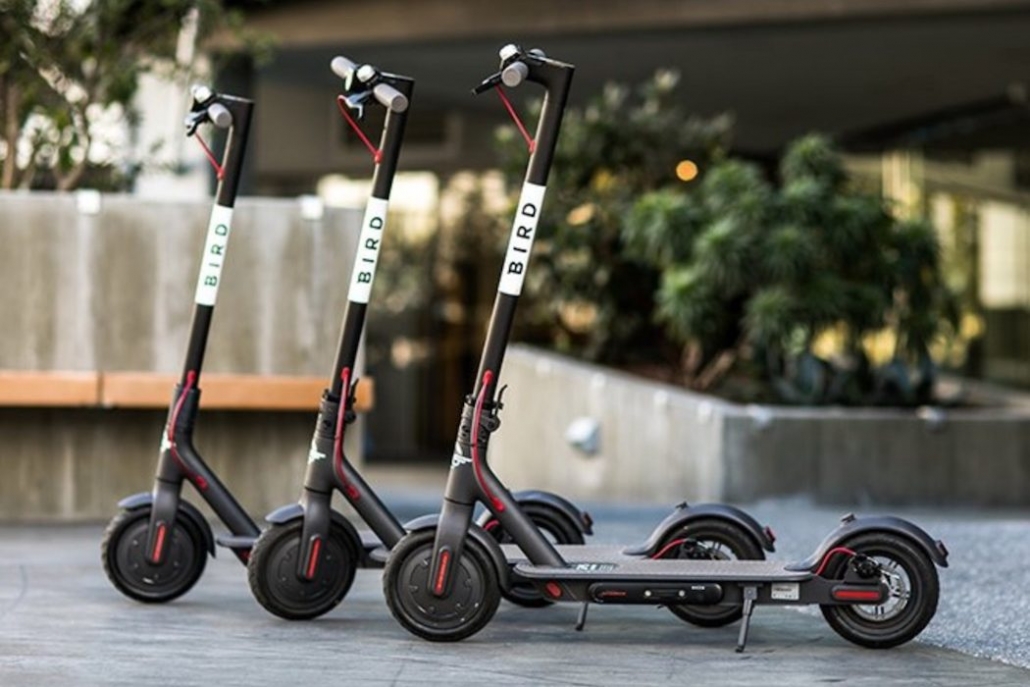
A trial in Coventry was paused after five days following concerns over pedestrian safety and e-scooters being abandoned on the streets.
Voi Technology’s general manager, Richard Corbett, said: “Voi is making use of licence plates to help identify any misuse of our e-scooters, as well as investing in ambassadors on the streets to ensure that any anti-social behaviour is stopped in its tracks.”
An e-scooter trial has also started in Cheltenham and Gloucester where Gloucestershire County Council has appointed e-scooter operator, Zwings.
The Zwings e-scooters began appearing on the streets on 1 October costing £1 to unlock, and then 15p or 20p a minute for every ride, depending on the location.
Riders of hired and leased e-scooters, through the West of England’s trial, can legally use them on roads, cycle lanes or cycle tracks and must hold a full or provisional driving licence.
Currently, privately-owned e-scooters are banned to use in the UK anywhere except on private land.
The Transport Committee of MPs has arguede-scooters should be legalised on roads but riding on pavements should be prohibited.
New Arrival
 72V 40Ah 4000W New Developed Private Big Power Moutain Electric MotorcycleMay 13, 2025 - 9:40 am
Latest News
 On May 1st 2025, The Factory Removed to a Wider and Newer BuildingMay 14, 2025 - 9:21 am